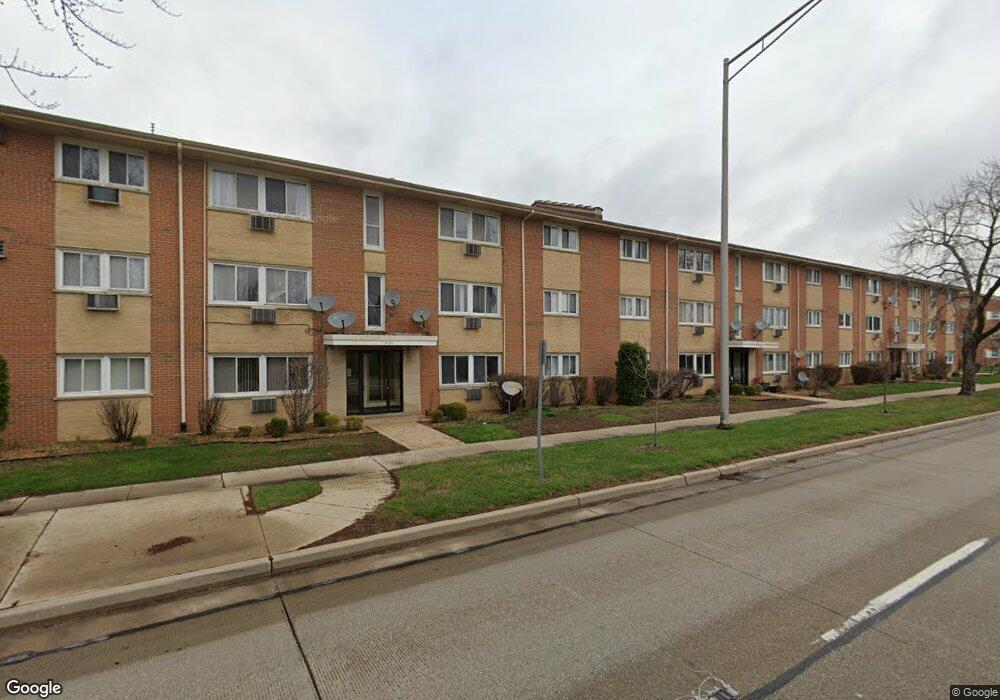
4450 W 111th St Unit 445024 Oak Lawn, IL 60453
Estimated Value: $120,000 - $138,707
2
Beds
1
Bath
900
Sq Ft
$147/Sq Ft
Est. Value
About This Home
This home is located at 4450 W 111th St Unit 445024, Oak Lawn, IL 60453 and is currently estimated at $131,927, approximately $146 per square foot. 4450 W 111th St Unit 445024 is a home located in Cook County with nearby schools including Stony Creek Elementary School, Prairie Jr High School, and Harold L. Richards High School.
Ownership History
Date
Name
Owned For
Owner Type
Purchase Details
Closed on
Dec 14, 2015
Sold by
Nery Laura
Bought by
Rtl Enterprises Llc
Current Estimated Value
Purchase Details
Closed on
Aug 10, 2007
Sold by
Cunico Patrick R and Mclain Cunico Michelle R
Bought by
Nery Laura
Home Financials for this Owner
Home Financials are based on the most recent Mortgage that was taken out on this home.
Original Mortgage
$107,900
Interest Rate
6.71%
Mortgage Type
Purchase Money Mortgage
Purchase Details
Closed on
Sep 19, 2005
Sold by
Telander Development Co
Bought by
Cunico Patrick R and Mclain Michelle R
Home Financials for this Owner
Home Financials are based on the most recent Mortgage that was taken out on this home.
Original Mortgage
$99,920
Interest Rate
5.62%
Mortgage Type
New Conventional
Create a Home Valuation Report for This Property
The Home Valuation Report is an in-depth analysis detailing your home's value as well as a comparison with similar homes in the area
Home Values in the Area
Average Home Value in this Area
Purchase History
| Date | Buyer | Sale Price | Title Company |
|---|---|---|---|
| Rtl Enterprises Llc | $57,000 | None Available | |
| Nery Laura | $135,000 | Ticor Title | |
| Cunico Patrick R | $125,000 | Ticor Title Insurance Compan |
Source: Public Records
Mortgage History
| Date | Status | Borrower | Loan Amount |
|---|---|---|---|
| Previous Owner | Nery Laura | $107,900 | |
| Previous Owner | Cunico Patrick R | $99,920 |
Source: Public Records
Tax History Compared to Growth
Tax History
| Year | Tax Paid | Tax Assessment Tax Assessment Total Assessment is a certain percentage of the fair market value that is determined by local assessors to be the total taxable value of land and additions on the property. | Land | Improvement |
|---|---|---|---|---|
| 2024 | $3,297 | $10,876 | $847 | $10,029 |
| 2023 | $2,438 | $10,876 | $847 | $10,029 |
| 2022 | $2,438 | $6,599 | $959 | $5,640 |
| 2021 | $2,324 | $6,599 | $959 | $5,640 |
| 2020 | $2,311 | $6,599 | $959 | $5,640 |
| 2019 | $2,115 | $5,883 | $874 | $5,009 |
| 2018 | $2,034 | $5,883 | $874 | $5,009 |
| 2017 | $879 | $5,883 | $874 | $5,009 |
| 2016 | $2,325 | $8,772 | $733 | $8,039 |
| 2015 | $2,275 | $8,772 | $733 | $8,039 |
| 2014 | $1,977 | $8,772 | $733 | $8,039 |
| 2013 | $2,404 | $9,828 | $733 | $9,095 |
Source: Public Records
Map
Nearby Homes
- 4325 Adeline Dr
- 4343 W 109th St
- 4328 W 109th St
- 10909 S Knox Ave
- 10800 S Kostner Ave
- 10851 S Keating Ave Unit 1D
- 10908 Keating Ave
- 10713 S Kenneth Ave
- 10823 S Keeler Ave
- 4829 W 109th St Unit 203
- 10828 S Pulaski Rd
- 4917 W 109th St Unit 202
- 11534 S Lee Rd
- 11604 S Kenneth Ave
- 5128 W 113th St
- 11553 S Joalyce Dr
- 11152 S Lawler Ave
- 10728 S Pulaski Rd
- 4837 W 107th St
- 10720 Lamon Ave
- 4450 W 111th St Unit 445020
- 4450 W 111th St Unit 445018
- 4450 W 111th St Unit 445022
- 4450 W 111th St Unit 445021
- 4450 W 111th St Unit 445025
- 4450 W 111th St Unit 445023
- 4450 W 111th St Unit 445019
- 4450 W 111th St Unit 22
- 4450 W 111th St Unit 19
- 4450 W 111th St Unit 23
- 11037 S Kenneth Ave Unit 28
- 11037 S Kenneth Ave Unit 27
- 11037 S Kilbourn Ave Unit 11037
- 11037 S Kilbourn Ave Unit 28
- 11037 S Kilbourn Ave Unit 24
- 11037 S Kilbourn Ave Unit 27
- 11037 S Kilbourn Ave Unit 25
- 4440 W 111th St Unit 14
- 4440 W 111th St Unit 444012
- 4440 W 111th St Unit 444014