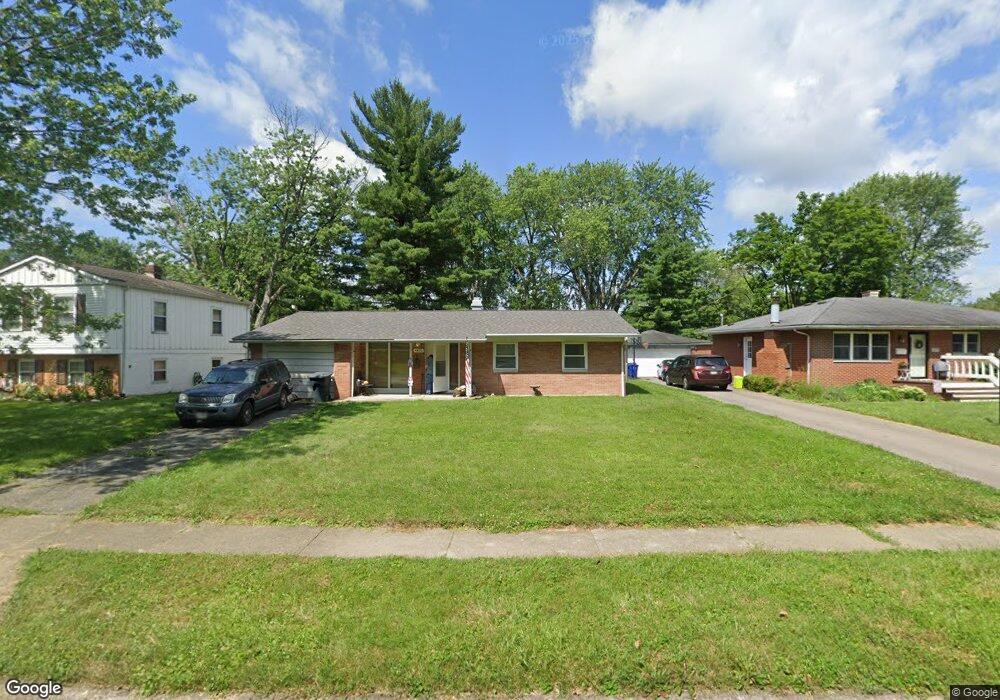
4451 Danforth Rd Columbus, OH 43224
Clinton Estates NeighborhoodEstimated Value: $200,000 - $277,000
3
Beds
2
Baths
1,262
Sq Ft
$197/Sq Ft
Est. Value
About This Home
This home is located at 4451 Danforth Rd, Columbus, OH 43224 and is currently estimated at $248,138, approximately $196 per square foot. 4451 Danforth Rd is a home located in Franklin County with nearby schools including Maize Road Elementary School, Medina Middle School, and Mifflin High School.
Ownership History
Date
Name
Owned For
Owner Type
Purchase Details
Closed on
Mar 25, 2014
Sold by
Bennett Paul D
Bought by
Bennett Douglas E
Current Estimated Value
Home Financials for this Owner
Home Financials are based on the most recent Mortgage that was taken out on this home.
Original Mortgage
$81,400
Outstanding Balance
$61,530
Interest Rate
4.5%
Mortgage Type
FHA
Estimated Equity
$186,608
Purchase Details
Closed on
Nov 25, 2009
Sold by
Trago Gary D and Burt Susan D
Bought by
Bennett Paul D
Home Financials for this Owner
Home Financials are based on the most recent Mortgage that was taken out on this home.
Original Mortgage
$81,776
Interest Rate
5.11%
Mortgage Type
FHA
Purchase Details
Closed on
Jun 12, 2009
Sold by
Estate Of Stephen T Bentine
Bought by
Trago Gary D and Burt Susan D
Purchase Details
Closed on
Oct 26, 1972
Bought by
Bentine Stephen T
Create a Home Valuation Report for This Property
The Home Valuation Report is an in-depth analysis detailing your home's value as well as a comparison with similar homes in the area
Home Values in the Area
Average Home Value in this Area
Purchase History
| Date | Buyer | Sale Price | Title Company |
|---|---|---|---|
| Bennett Douglas E | $90,000 | Valmer Land Title Agency Box | |
| Bennett Paul D | $83,300 | Title First | |
| Trago Gary D | -- | None Available | |
| Bentine Stephen T | -- | -- |
Source: Public Records
Mortgage History
| Date | Status | Borrower | Loan Amount |
|---|---|---|---|
| Open | Bennett Douglas E | $81,400 | |
| Previous Owner | Bennett Paul D | $81,776 |
Source: Public Records
Tax History
| Year | Tax Paid | Tax Assessment Tax Assessment Total Assessment is a certain percentage of the fair market value that is determined by local assessors to be the total taxable value of land and additions on the property. | Land | Improvement |
|---|---|---|---|---|
| 2025 | $2,851 | $73,330 | $22,330 | $51,000 |
| 2024 | $2,851 | $73,330 | $22,330 | $51,000 |
| 2023 | $2,843 | $73,325 | $22,330 | $50,995 |
| 2022 | $1,835 | $44,140 | $9,590 | $34,550 |
| 2021 | $1,839 | $44,140 | $9,590 | $34,550 |
| 2020 | $1,841 | $44,140 | $9,590 | $34,550 |
| 2019 | $2,154 | $35,500 | $7,670 | $27,830 |
| 2018 | $1,960 | $35,500 | $7,670 | $27,830 |
| 2017 | $2,051 | $35,500 | $7,670 | $27,830 |
| 2016 | $1,950 | $29,440 | $7,490 | $21,950 |
| 2015 | $1,770 | $29,440 | $7,490 | $21,950 |
| 2014 | $1,825 | $29,440 | $7,490 | $21,950 |
| 2013 | $947 | $30,975 | $7,875 | $23,100 |
Source: Public Records
Map
Nearby Homes
- 1310 Fowler Dr
- 4143 Karl Rd Unit 215
- 4143 Karl Rd Unit 314
- 4145 Karl Rd Unit 223
- 1144 Reed Circle Dr
- 1130 Carbone Dr
- 4800 Bourke Rd
- 4795 Colonel Perry Dr
- 3967 Karl Rd Unit 224
- 3941 Karl Rd Unit 326
- 1116 Tulsa Dr
- 3939 Karl Rd Unit 311
- 4904 Almont Dr
- 1637 Sale Rd
- 4923 Karl Rd Unit 4925
- 899 Meadowview Dr
- 1485 Norma Rd
- 4983 Almont Dr
- 4605 Glenmawr Ave
- 5004 Julie Place
- 4443 Danforth Rd
- 4459 Danforth Rd
- 4467 Danforth Rd
- 4431 Danforth Rd
- 1370 Fowler Dr
- 4456 Midvale Rd
- 4448 Midvale Rd
- 1362 Fowler Dr
- 4464 Midvale Rd
- 4475 Danforth Rd
- 4456 Danforth Rd
- 4448 Danforth Rd
- 4464 Danforth Rd
- 1354 Fowler Dr
- 4440 Danforth Rd
- 4472 Midvale Rd
- 4472 Danforth Rd
- 4483 Danforth Rd
- 4438 Midvale Rd
- 1408 Fowler Dr
Your Personal Tour Guide
Ask me questions while you tour the home.