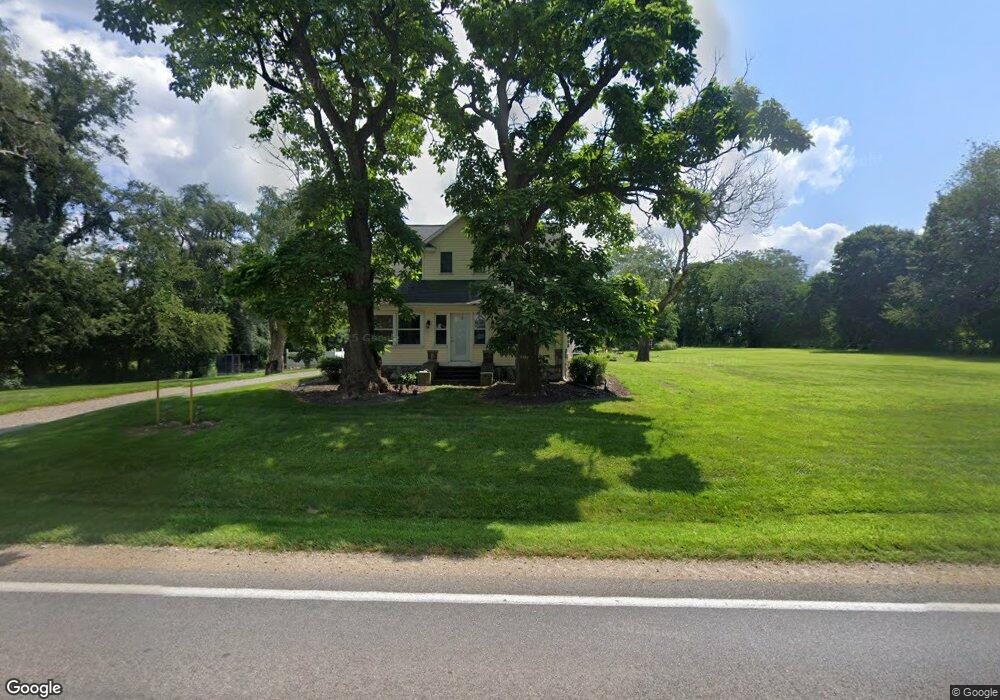
4451 S Edon Rd Reading, MI 49274
Estimated Value: $204,000 - $306,000
--
Bed
1
Bath
1,148
Sq Ft
$208/Sq Ft
Est. Value
About This Home
This home is located at 4451 S Edon Rd, Reading, MI 49274 and is currently estimated at $239,146, approximately $208 per square foot. 4451 S Edon Rd is a home located in Hillsdale County with nearby schools including Reynolds Elementary School, Reading High School, and Cooper Amish School.
Ownership History
Date
Name
Owned For
Owner Type
Purchase Details
Closed on
Jul 13, 2004
Sold by
Jones Greg C
Bought by
Jones Greg C and Caparrotti Francesca
Current Estimated Value
Home Financials for this Owner
Home Financials are based on the most recent Mortgage that was taken out on this home.
Original Mortgage
$107,000
Outstanding Balance
$55,299
Interest Rate
6.75%
Mortgage Type
New Conventional
Estimated Equity
$183,847
Purchase Details
Closed on
Jan 30, 2002
Sold by
Fowler Gary N and Fowler Linda E
Bought by
Jones Greg C
Purchase Details
Closed on
Dec 27, 2001
Sold by
Fowler Gary N and Fowler Linda E
Bought by
Branch County Federal S & L Assoc
Purchase Details
Closed on
Dec 12, 2001
Sold by
Fowler Gary N and Fowler Linda E
Bought by
Branch County Federal S & L Assoc
Purchase Details
Closed on
Aug 14, 1999
Sold by
Kerspilo John C
Bought by
Fowler Gary N and Fowler Linda E
Purchase Details
Closed on
Jul 14, 1999
Sold by
Kerspilo John C and Kerspilo Geraldine M
Bought by
Fowler Gary N and Fowler Linda E
Create a Home Valuation Report for This Property
The Home Valuation Report is an in-depth analysis detailing your home's value as well as a comparison with similar homes in the area
Home Values in the Area
Average Home Value in this Area
Purchase History
| Date | Buyer | Sale Price | Title Company |
|---|---|---|---|
| Jones Greg C | -- | Northwest Title & Escrow | |
| Jones Greg C | $86,400 | -- | |
| Branch County Federal S & L Assoc | $15,200 | -- | |
| Branch County Federal S & L Assoc | $66,500 | -- | |
| Fowler Gary N | $74,000 | -- | |
| Fowler Gary N | $74,000 | -- |
Source: Public Records
Mortgage History
| Date | Status | Borrower | Loan Amount |
|---|---|---|---|
| Open | Jones Greg C | $107,000 |
Source: Public Records
Tax History Compared to Growth
Tax History
| Year | Tax Paid | Tax Assessment Tax Assessment Total Assessment is a certain percentage of the fair market value that is determined by local assessors to be the total taxable value of land and additions on the property. | Land | Improvement |
|---|---|---|---|---|
| 2025 | $1,776 | $113,300 | $0 | $0 |
| 2024 | $731 | $101,800 | $0 | $0 |
| 2023 | $696 | $96,700 | $0 | $0 |
| 2022 | $1,561 | $84,500 | $0 | $0 |
| 2021 | $1,518 | $74,100 | $0 | $0 |
| 2020 | $1,506 | $73,000 | $0 | $0 |
| 2019 | $1,449 | $61,100 | $0 | $0 |
| 2018 | $1,382 | $55,300 | $0 | $0 |
| 2017 | $1,389 | $56,400 | $0 | $0 |
| 2016 | $1,240 | $52,000 | $0 | $0 |
| 2015 | $550 | $52,000 | $0 | $0 |
| 2013 | $534 | $48,750 | $0 | $0 |
| 2012 | $527 | $48,070 | $0 | $0 |
Source: Public Records
Map
Nearby Homes
- 5160 Quackenbush Rd
- 203 E Michigan St
- 108 Lynn St
- 309 S Main St
- 0 W Silver St Unit 25044322
- 5211 Long Lake Rd
- 3870 Rus Dic Dr
- 4427 Carpenter Rd
- 2520 S Sand Lake Rd
- 5411 Lilac Rd
- 4111 Blair Rd
- 2201 S Sand Lake Rd
- 4421 Carpenter Rd
- 2408 Spruce Dr
- 2251 Hemlock Rd
- 3553 Alpine Ct
- 3549 Majestic Ct
- 4048 Bankers Rd
- 4164 S Pleasant Dr
- 4150 S Lake Wilson Rd
- 4420 S Edon Rd
- 4571 S Edon Rd
- 4600 S Edon Rd
- 4640 S Edon Rd
- 4660 S Edon Rd
- 4708 S Edon Rd
- 4751 S Edon Rd
- 4100 S Edon Rd
- VL Quackenbush Rd
- 6667 Quackenbush Rd
- 7060 Card Rd
- 7060 Card Rd
- 6582 Card Rd
- 5051 S Edon Rd
- 6300 Quackenbush Rd
- 6670 Quackenbush Rd
- 6891 Card Rd
- 5110 S Edon Rd
- 6727 Card Rd
- 5200 S Edon Rd