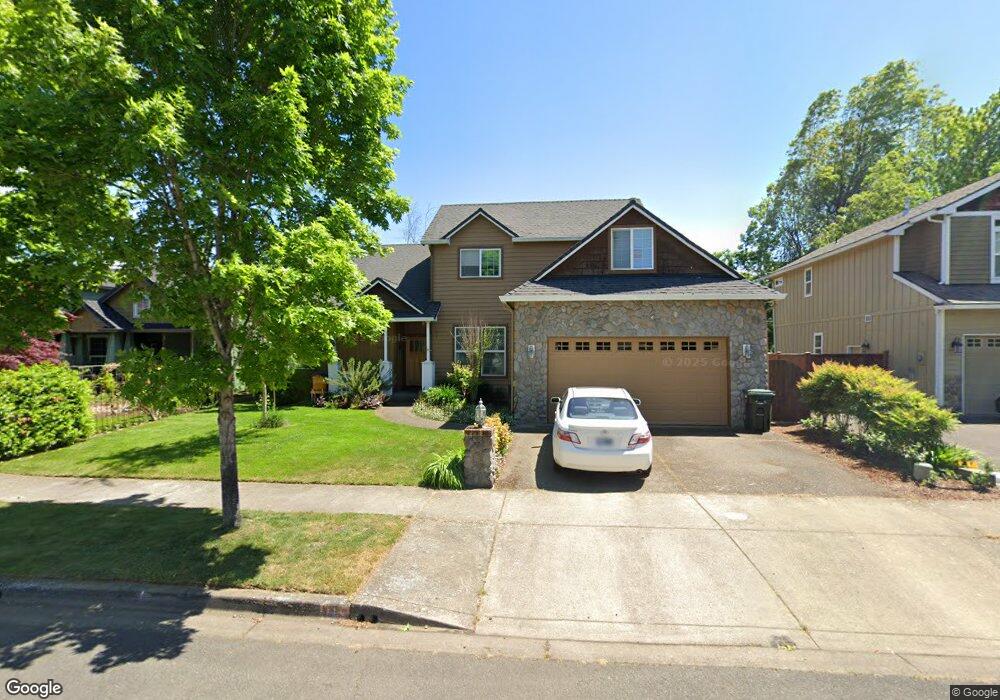
4453 Calumet Way Eugene, OR 97404
Santa Clara NeighborhoodEstimated Value: $560,000 - $591,000
4
Beds
7
Baths
1,994
Sq Ft
$289/Sq Ft
Est. Value
About This Home
This home is located at 4453 Calumet Way, Eugene, OR 97404 and is currently estimated at $575,580, approximately $288 per square foot. 4453 Calumet Way is a home located in Lane County with nearby schools including Awbrey Park Elementary School, Madison Middle School, and North Eugene High School.
Ownership History
Date
Name
Owned For
Owner Type
Purchase Details
Closed on
Oct 24, 2023
Sold by
Crossler Mark A and Crossler Sandra K
Bought by
Crossler Living Trust and Crossler
Current Estimated Value
Purchase Details
Closed on
Dec 15, 2004
Sold by
Horn Stephen and Horn Debby
Bought by
Crossler Mark A and Crossler Sandra K
Home Financials for this Owner
Home Financials are based on the most recent Mortgage that was taken out on this home.
Original Mortgage
$110,000
Interest Rate
5.7%
Mortgage Type
Purchase Money Mortgage
Purchase Details
Closed on
Nov 8, 2001
Sold by
Anderson Development Llc
Bought by
Horn Stephen and Horn Debby
Home Financials for this Owner
Home Financials are based on the most recent Mortgage that was taken out on this home.
Original Mortgage
$178,800
Interest Rate
6.73%
Create a Home Valuation Report for This Property
The Home Valuation Report is an in-depth analysis detailing your home's value as well as a comparison with similar homes in the area
Home Values in the Area
Average Home Value in this Area
Purchase History
| Date | Buyer | Sale Price | Title Company |
|---|---|---|---|
| Crossler Living Trust | -- | None Listed On Document | |
| Crossler Mark A | $282,000 | Western Title & Escrow Co | |
| Horn Stephen | $223,500 | Western Pioneer Title Co |
Source: Public Records
Mortgage History
| Date | Status | Borrower | Loan Amount |
|---|---|---|---|
| Previous Owner | Crossler Mark A | $110,000 | |
| Previous Owner | Horn Stephen | $178,800 | |
| Closed | Horn Stephen | $22,350 |
Source: Public Records
Tax History Compared to Growth
Tax History
| Year | Tax Paid | Tax Assessment Tax Assessment Total Assessment is a certain percentage of the fair market value that is determined by local assessors to be the total taxable value of land and additions on the property. | Land | Improvement |
|---|---|---|---|---|
| 2025 | $6,168 | $316,559 | -- | -- |
| 2024 | $6,091 | $307,339 | -- | -- |
| 2023 | $6,091 | $298,388 | $0 | $0 |
| 2022 | $5,706 | $289,698 | $0 | $0 |
| 2021 | $5,360 | $281,261 | $0 | $0 |
| 2020 | $5,379 | $273,069 | $0 | $0 |
| 2019 | $5,195 | $265,116 | $0 | $0 |
| 2018 | $4,890 | $249,898 | $0 | $0 |
| 2017 | $4,584 | $249,898 | $0 | $0 |
| 2016 | $4,421 | $242,619 | $0 | $0 |
| 2015 | $4,231 | $235,552 | $0 | $0 |
| 2014 | $4,147 | $228,691 | $0 | $0 |
Source: Public Records
Map
Nearby Homes
- 415 Spring Creek Dr
- 363 Spring Creek Dr
- 4663 Calumet Way
- 233 Spring Creek Dr
- 4385 Berry Ln
- 110 Calumet Ave
- 114 Calumet Cir
- 184 Redrock Way
- 4015 Scenic Dr Unit 4027
- 577 Dublin Ave
- 812 E Beacon Dr
- 4362 Katy Ln
- 0 E Beacon Dr Unit 645105801
- 320 E Beacon Dr
- 3835 River Rd
- 4060 Hampshire Ln
- 3724 Alladin Way
- 3774 Kirsten St
- 35 Daniel Dr
- 3565 Castrey St
- 4439 Calumet Way
- 4410 Herman St
- 4481 Calumet Way
- 4425 Calumet Way
- 4444 Calumet Way
- 4476 Calumet Way
- 520 Mahonia Ln
- 508 Mahonia Ln
- 4415 Calumet Way
- 4490 Calumet Way
- 4402 Herman St
- 530 Mahonia Ln
- 4374 Herman St
- 4416 Herman St
- 4485 Briars St
- 4461 Briars St
- 484 Emily Ln
- 540 Mahonia Ln
- 466 Emily Ln
- 4510 Calumet Way