Estimated Value: $137,085 - $161,000
Studio
--
Bath
995
Sq Ft
$148/Sq Ft
Est. Value
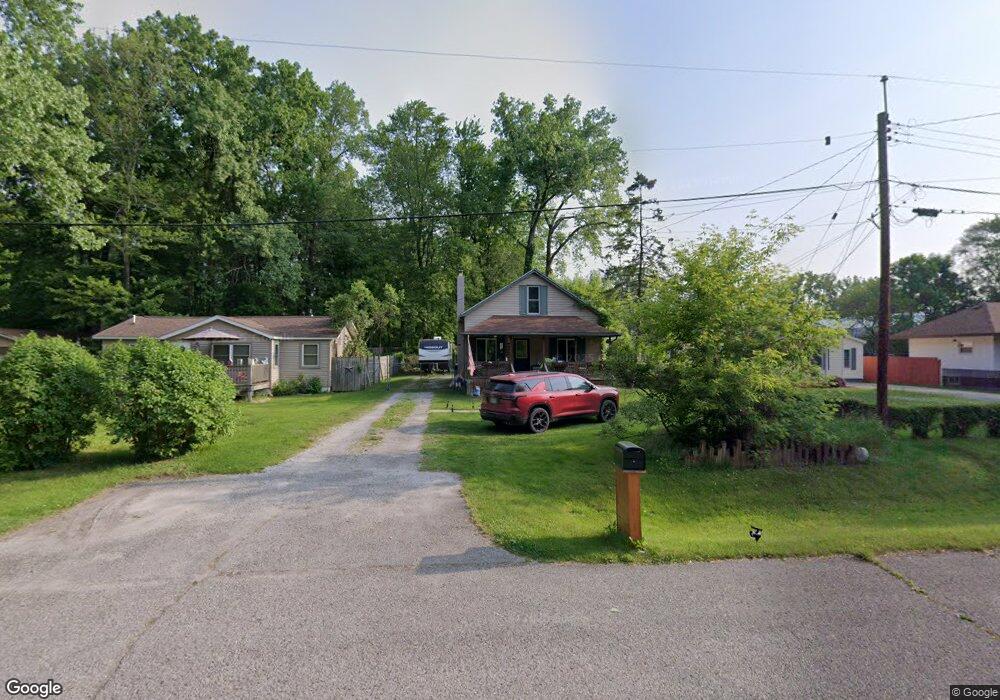
About This Home
This home is located at 4453 La Bean Ct, Flint, MI 48506 and is currently estimated at $147,021, approximately $147 per square foot. 4453 La Bean Ct is a home located in Genesee County with nearby schools including Weston Elementary School, Kate Dowdall Elementary School, and Leota Fiedler Elementary School.
Ownership History
Date
Name
Owned For
Owner Type
Purchase Details
Closed on
Sep 27, 2021
Sold by
Odglen Anthony J
Bought by
Suttle Billy Sherman
Current Estimated Value
Home Financials for this Owner
Home Financials are based on the most recent Mortgage that was taken out on this home.
Original Mortgage
$121,634
Outstanding Balance
$110,678
Interest Rate
2.8%
Mortgage Type
VA
Estimated Equity
$36,343
Purchase Details
Closed on
Mar 13, 2002
Sold by
Equicredit Corp Of America
Bought by
Odglen Anthony J
Purchase Details
Closed on
Mar 28, 2001
Sold by
Petrosky Lisette
Bought by
Equicredit Corp Of America
Purchase Details
Closed on
Oct 27, 1999
Sold by
Petrosky Stephen
Bought by
Petrosky Lisette
Home Financials for this Owner
Home Financials are based on the most recent Mortgage that was taken out on this home.
Original Mortgage
$68,000
Interest Rate
7.78%
Mortgage Type
Balloon
Create a Home Valuation Report for This Property
The Home Valuation Report is an in-depth analysis detailing your home's value as well as a comparison with similar homes in the area
Home Values in the Area
Average Home Value in this Area
Purchase History
| Date | Buyer | Sale Price | Title Company |
|---|---|---|---|
| Suttle Billy Sherman | $118,900 | Cislo Title | |
| Odglen Anthony J | $66,000 | First American Title Ins Co | |
| Equicredit Corp Of America | $60,515 | -- | |
| Petrosky Lisette | -- | Fidelity National Title Ins |
Source: Public Records
Mortgage History
| Date | Status | Borrower | Loan Amount |
|---|---|---|---|
| Open | Suttle Billy Sherman | $121,634 | |
| Previous Owner | Petrosky Lisette | $68,000 |
Source: Public Records
Tax History
| Year | Tax Paid | Tax Assessment Tax Assessment Total Assessment is a certain percentage of the fair market value that is determined by local assessors to be the total taxable value of land and additions on the property. | Land | Improvement |
|---|---|---|---|---|
| 2025 | $2,151 | $60,000 | $0 | $0 |
| 2024 | $595 | $55,800 | $0 | $0 |
| 2023 | $568 | $51,300 | $0 | $0 |
| 2022 | $1,192 | $47,000 | $0 | $0 |
| 2021 | $898 | $35,500 | $0 | $0 |
| 2020 | $243 | $32,000 | $0 | $0 |
| 2019 | $240 | $28,200 | $0 | $0 |
| 2018 | $1,223 | $26,100 | $0 | $0 |
| 2017 | $1,179 | $25,600 | $0 | $0 |
| 2016 | $1,170 | $23,700 | $0 | $0 |
| 2015 | $1,013 | $21,600 | $0 | $0 |
| 2014 | $221 | $19,600 | $0 | $0 |
| 2012 | -- | $21,200 | $21,200 | $0 |
Source: Public Records
Map
Nearby Homes
- 4453 Market Place
- 4459 Market Place
- 4441 Market Place
- 4435 Market Place
- 4465 Market Place
- 4425 Market Place
- 4417 Market Place
- 4414 Market Place
- 0000 Home Town Dr
- 4489 Home Town Dr Unit 32
- 4455 N Genesee Rd
- 4452 Muriel Dr
- 5131 E Carpenter Rd
- 5067 Paro Dr
- 4455 Burgundy Dr
- 5964 Kader Dr
- 4392 E Coldwater Rd
- 3430 N Genesee Rd
- 5492 N Genesee Rd
- 6065 N Genesee Rd
- 4453 Labean Ct
- 4449 La Bean Ct
- 4457 La Bean Ct
- 4471 La Bean Ct
- 4465 La Bean Ct
- 4437 La Bean Ct
- 4477 Labean Ct
- 4477 La Bean Ct
- 4466 La Bean Ct
- 4483 La Bean Ct
- 4472 La Bean Ct
- 4450 La Bean Ct
- 4476 La Bean Ct
- 4491 La Bean Ct
- 4488 La Bean Ct
- 4440 La Bean Ct
- 4494 La Bean Ct
- 4499 La Bean Ct
- 5081 N Genesee Rd
- 4502 La Bean Ct
Your Personal Tour Guide
Ask me questions while you tour the home.