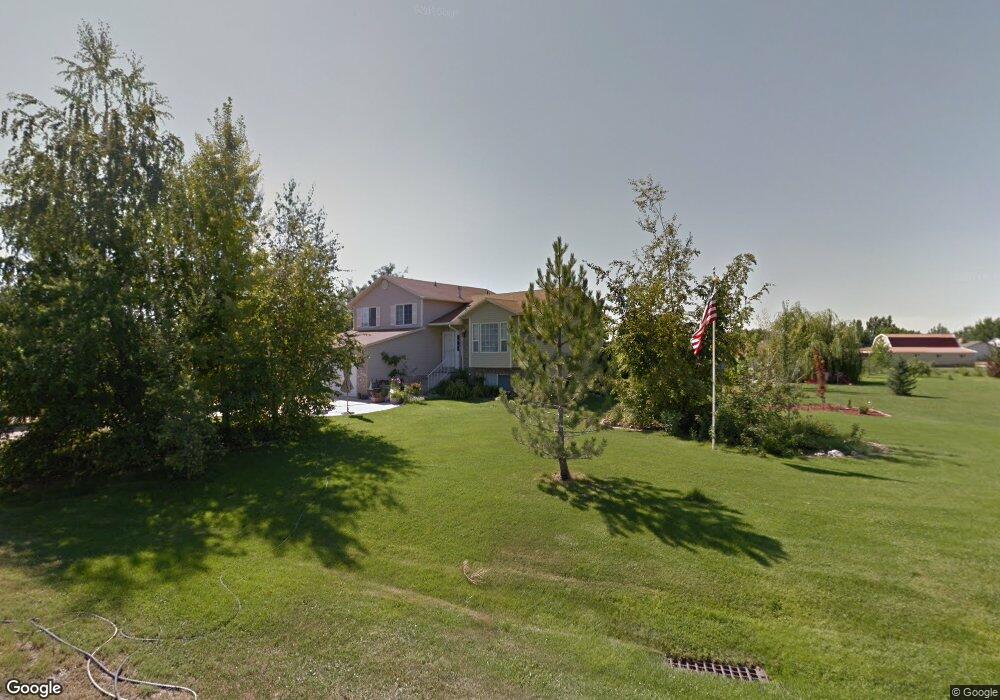
4453 S 4500 W West Haven, UT 84401
Estimated Value: $539,000 - $606,000
4
Beds
3
Baths
1,600
Sq Ft
$363/Sq Ft
Est. Value
About This Home
This home is located at 4453 S 4500 W, West Haven, UT 84401 and is currently estimated at $580,906, approximately $363 per square foot. 4453 S 4500 W is a home located in Weber County with nearby schools including Country View School, Rocky Mountain Junior High School, and Fremont High School.
Ownership History
Date
Name
Owned For
Owner Type
Purchase Details
Closed on
Jun 7, 2012
Sold by
Voss Myron A and Voss Alverna K
Bought by
America First Fcu
Current Estimated Value
Purchase Details
Closed on
Sep 22, 2008
Sold by
Voss Myron A
Bought by
Voss Myron A
Home Financials for this Owner
Home Financials are based on the most recent Mortgage that was taken out on this home.
Original Mortgage
$146,950
Interest Rate
5.6%
Mortgage Type
Stand Alone Refi Refinance Of Original Loan
Purchase Details
Closed on
Dec 17, 1996
Sold by
Mark Higley Construction Lc
Bought by
Voss Myron A
Home Financials for this Owner
Home Financials are based on the most recent Mortgage that was taken out on this home.
Original Mortgage
$146,778
Interest Rate
7.67%
Mortgage Type
VA
Purchase Details
Closed on
Apr 12, 1996
Sold by
Beutler John
Bought by
Mark Higley Construction Lc
Purchase Details
Closed on
Feb 26, 1996
Sold by
Mountain View Title & Escrow Inc
Bought by
Beutler John
Create a Home Valuation Report for This Property
The Home Valuation Report is an in-depth analysis detailing your home's value as well as a comparison with similar homes in the area
Home Values in the Area
Average Home Value in this Area
Purchase History
| Date | Buyer | Sale Price | Title Company |
|---|---|---|---|
| America First Fcu | -- | First American Title | |
| Voss Myron A | -- | First American Legend Hills | |
| Voss Myron A | -- | Mountain View Title | |
| Mark Higley Construction Lc | -- | Mountain View Title | |
| Beutler John | -- | Mountain View Title |
Source: Public Records
Mortgage History
| Date | Status | Borrower | Loan Amount |
|---|---|---|---|
| Previous Owner | Voss Myron A | $146,950 | |
| Previous Owner | Voss Myron A | $146,778 |
Source: Public Records
Tax History Compared to Growth
Tax History
| Year | Tax Paid | Tax Assessment Tax Assessment Total Assessment is a certain percentage of the fair market value that is determined by local assessors to be the total taxable value of land and additions on the property. | Land | Improvement |
|---|---|---|---|---|
| 2025 | $2,950 | $487,500 | $180,009 | $307,491 |
| 2024 | $2,795 | $263,999 | $99,004 | $164,995 |
| 2023 | $2,671 | $255,200 | $99,005 | $156,195 |
| 2022 | $2,942 | $270,050 | $99,005 | $171,045 |
| 2021 | $2,530 | $390,000 | $94,243 | $295,757 |
| 2020 | $2,390 | $352,000 | $79,915 | $272,085 |
| 2019 | $2,209 | $317,000 | $79,899 | $237,101 |
| 2018 | $2,051 | $290,000 | $66,078 | $223,922 |
| 2017 | $1,853 | $257,000 | $65,929 | $191,071 |
| 2016 | $1,927 | $122,994 | $29,586 | $93,408 |
| 2015 | $1,869 | $118,546 | $29,586 | $88,960 |
| 2014 | $1,725 | $107,621 | $29,586 | $78,035 |
Source: Public Records
Map
Nearby Homes
- 4712 W 4100 S
- 4756 S 4300 W
- 4094 W 4700 S
- 4521 W 3950 S Unit 5
- 4931 S 4700 W
- 4097 W 4750 S
- 3880 S 4550 W
- 4106 W 4875 S
- 4141 W 4875 S
- 3191 S 5100 St W Unit 1
- 5071 W 4175 S
- 4643 S 3900 W
- 4890 S 4075 W
- 5013 S 4150 W
- 4218 W 5050 S
- 4879 S 5050 W
- 3984 W 4000 S
- 4990 S 4075 W
- 5116 S 4300 W
- 3795 S 4250 W Unit D