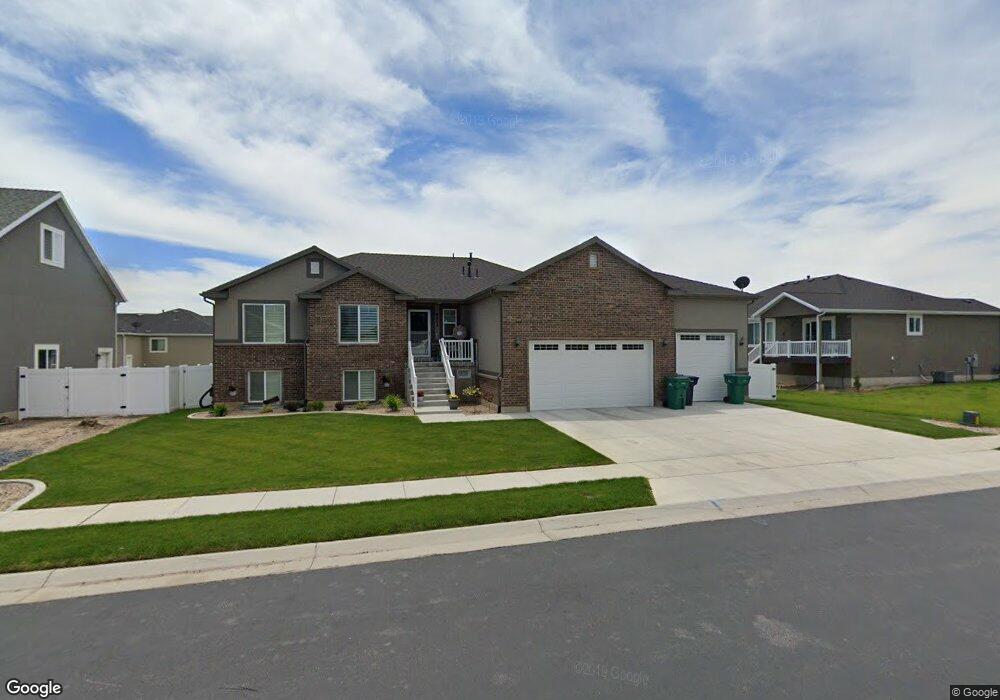
4453 W 5225 S Unit 65 Hooper, UT 84315
Estimated Value: $634,000 - $690,000
5
Beds
4
Baths
3,375
Sq Ft
$194/Sq Ft
Est. Value
About This Home
This home is located at 4453 W 5225 S Unit 65, Hooper, UT 84315 and is currently estimated at $655,750, approximately $194 per square foot. 4453 W 5225 S Unit 65 is a home located in Weber County with nearby schools including Country View School, Rocky Mountain Junior High School, and Bridge Elementary School.
Ownership History
Date
Name
Owned For
Owner Type
Purchase Details
Closed on
May 16, 2016
Bought by
Johnson Matthew T
Current Estimated Value
Home Financials for this Owner
Home Financials are based on the most recent Mortgage that was taken out on this home.
Original Mortgage
$323,000
Outstanding Balance
$253,560
Interest Rate
3.57%
Estimated Equity
$402,190
Purchase Details
Closed on
Jul 2, 2014
Sold by
Hamblin Investments Inc
Bought by
Sierra Homes Constuction Inc
Home Financials for this Owner
Home Financials are based on the most recent Mortgage that was taken out on this home.
Original Mortgage
$1,316,250
Interest Rate
4.18%
Mortgage Type
Future Advance Clause Open End Mortgage
Create a Home Valuation Report for This Property
The Home Valuation Report is an in-depth analysis detailing your home's value as well as a comparison with similar homes in the area
Home Values in the Area
Average Home Value in this Area
Purchase History
| Date | Buyer | Sale Price | Title Company |
|---|---|---|---|
| Johnson Matthew T | -- | -- | |
| Sierra Homes Constuction Inc | -- | Mountain View Title |
Source: Public Records
Mortgage History
| Date | Status | Borrower | Loan Amount |
|---|---|---|---|
| Open | Johnson Matthew T | $323,000 | |
| Closed | Johnson Matthew T | -- | |
| Previous Owner | Sierra Homes Constuction Inc | $1,316,250 |
Source: Public Records
Tax History
| Year | Tax Paid | Tax Assessment Tax Assessment Total Assessment is a certain percentage of the fair market value that is determined by local assessors to be the total taxable value of land and additions on the property. | Land | Improvement |
|---|---|---|---|---|
| 2025 | $3,495 | $609,573 | $197,629 | $411,944 |
| 2024 | $3,553 | $347,049 | $108,814 | $238,235 |
| 2023 | $3,461 | $334,950 | $108,572 | $226,378 |
| 2022 | $3,550 | $351,450 | $83,770 | $267,680 |
| 2021 | $2,991 | $499,000 | $107,110 | $391,890 |
| 2020 | $2,669 | $408,000 | $102,104 | $305,896 |
| 2019 | $2,684 | $388,000 | $101,402 | $286,598 |
| 2018 | $2,648 | $366,000 | $66,316 | $299,684 |
| 2017 | $2,555 | $342,000 | $66,066 | $275,934 |
| 2016 | $2,304 | $166,521 | $36,158 | $130,363 |
| 2015 | $851 | $60,637 | $60,637 | $0 |
| 2014 | $732 | $50,724 | $50,724 | $0 |
Source: Public Records
Map
Nearby Homes
- 4367 W 5300 S
- 4277 W 5250 S
- 4240 W 5300 S
- 4349 W 5430 S Unit D
- 4337 W 5430 St S A S Unit A
- 4216 W 5250 S
- 4488 W 4950 S
- 5397 S 4150 W
- 4218 W 5050 S
- 4700 W 5500 S
- 4088 W 5050 S
- 4931 S 4700 W
- 3959 W 5325 S
- 4756 S 4300 W
- 5644 S 4075 W
- 4021 W 5625 S
- 4950 3900 West St
- 4836 S 5050 W
- 4101 W 4600 S
- 3832 W 5625 S
- 4453 W 5225 S
- 5244 S 4475 W
- 4435 W 5225 S
- 5865 W 5225 S Unit 25
- 5849 W 5225 S Unit 24
- 5254 S 4475 W Unit 77
- 5255 S 4425 W
- 4454 W 5225 S Unit 66
- 4454 W 5225 S Unit 67
- 4436 W 5225 S
- 5269 S 4425 W
- 5284 S 4475 W
- 4474 W 5225 S
- 4482 W 5225 S
- 5232 S 4425 W
- 4426 W 5225 S
- 5247 S 4475 W
- 5233 S 4475 W
- 5248 S 4425 W
- 5220 S 4425 W