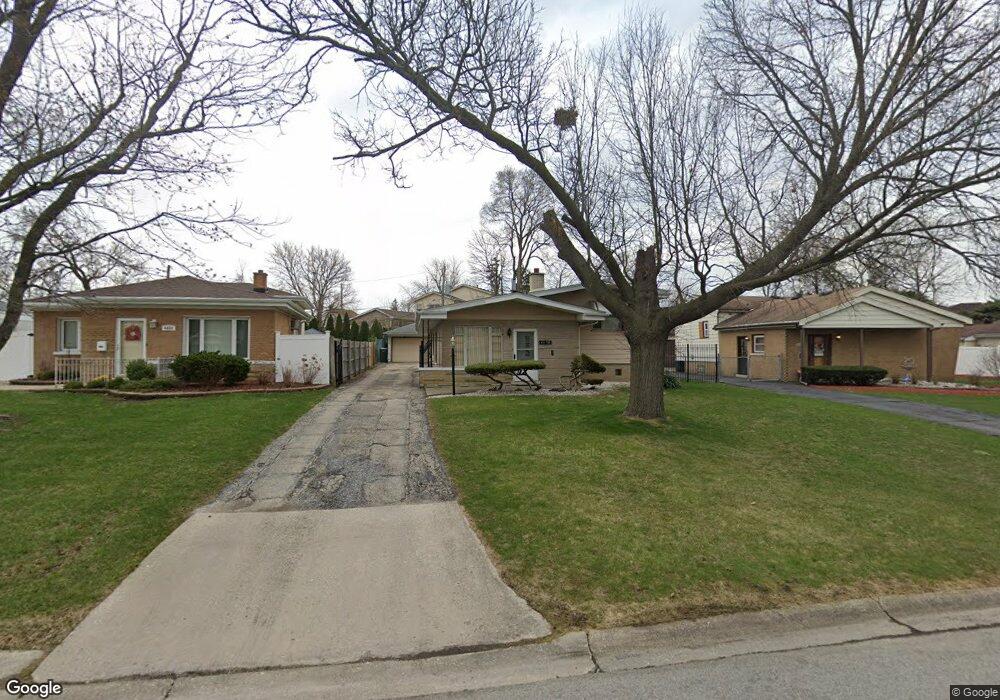
4454 Idlewild Ln Unit 3 Hillside, IL 60162
Estimated Value: $258,000 - $294,000
3
Beds
1
Bath
860
Sq Ft
$314/Sq Ft
Est. Value
About This Home
This home is located at 4454 Idlewild Ln Unit 3, Hillside, IL 60162 and is currently estimated at $269,934, approximately $313 per square foot. 4454 Idlewild Ln Unit 3 is a home located in Cook County with nearby schools including Hillside Elementary School, Proviso West High School, and Meca Elementary School.
Ownership History
Date
Name
Owned For
Owner Type
Purchase Details
Closed on
Oct 15, 1997
Sold by
Butler Arthur and Butler Katherine
Bought by
Patrick Bobby L
Current Estimated Value
Home Financials for this Owner
Home Financials are based on the most recent Mortgage that was taken out on this home.
Original Mortgage
$123,500
Outstanding Balance
$20,190
Interest Rate
7.65%
Estimated Equity
$249,744
Purchase Details
Closed on
Mar 2, 1995
Sold by
Murrell Katherine and Butler Willie E
Bought by
Butler Arthur and Butler Katherine
Purchase Details
Closed on
May 19, 1994
Sold by
Girotti Jorge A and Girotti Mariela H
Bought by
Murrell Katherine and Butler Willie E
Home Financials for this Owner
Home Financials are based on the most recent Mortgage that was taken out on this home.
Original Mortgage
$99,200
Interest Rate
8.34%
Create a Home Valuation Report for This Property
The Home Valuation Report is an in-depth analysis detailing your home's value as well as a comparison with similar homes in the area
Home Values in the Area
Average Home Value in this Area
Purchase History
| Date | Buyer | Sale Price | Title Company |
|---|---|---|---|
| Patrick Bobby L | $86,666 | -- | |
| Butler Arthur | -- | -- | |
| Murrell Katherine | $124,000 | Attorneys Title Guaranty Fun |
Source: Public Records
Mortgage History
| Date | Status | Borrower | Loan Amount |
|---|---|---|---|
| Open | Patrick Bobby L | $123,500 | |
| Previous Owner | Murrell Katherine | $99,200 |
Source: Public Records
Tax History Compared to Growth
Tax History
| Year | Tax Paid | Tax Assessment Tax Assessment Total Assessment is a certain percentage of the fair market value that is determined by local assessors to be the total taxable value of land and additions on the property. | Land | Improvement |
|---|---|---|---|---|
| 2024 | $1,317 | $21,000 | $3,963 | $17,037 |
| 2023 | $1,496 | $21,000 | $3,963 | $17,037 |
| 2022 | $1,496 | $16,509 | $2,702 | $13,807 |
| 2021 | $1,426 | $16,507 | $2,701 | $13,806 |
| 2020 | $1,291 | $16,507 | $2,701 | $13,806 |
| 2019 | $1,525 | $14,347 | $2,521 | $11,826 |
| 2018 | $1,484 | $14,347 | $2,521 | $11,826 |
| 2017 | $1,401 | $14,347 | $2,521 | $11,826 |
| 2016 | $2,331 | $10,900 | $2,341 | $8,559 |
| 2015 | $2,370 | $10,900 | $2,341 | $8,559 |
| 2014 | $2,344 | $10,900 | $2,341 | $8,559 |
| 2013 | $3,099 | $13,903 | $2,341 | $11,562 |
Source: Public Records
Map
Nearby Homes
- 335 Buckthorn Ln
- 502 Clayton Rd
- 4718 Butterfield Rd
- 549 51st Ave
- 514 Iroquois Rd
- 529 49th Ave
- 114 Oak Ridge Ave
- 134 S Maple Ave
- 520 N Wolf Rd Unit 301
- 417 Hyde Park Ave
- 605 N Wolf Rd Unit B9
- 605 N Wolf Rd Unit C12
- 543 Geneva Ave Unit 104A
- 408 51st Ave
- 425 47th Ave
- 3912 Adams St
- 3914 Madison St
- 429 Geneva Ave
- 3901 Jackson St
- 512 Englewood Ave
- 4450 Idlewild Ln
- 4504 Idlewild Ln
- 4446 Idlewild Ln
- 4451 Clayton Rd
- 4447 Clayton Rd
- 4507 Clayton Rd
- 4508 Idlewild Ln
- 4443 Clayton Rd
- 4511 Clayton Rd
- 4507 Idlewild Ln
- 4503 Idlewild Ln
- 4511 Idlewild Ln
- 226 Fenwood Ln
- 232 Fenwood Ln
- 220 Fenwood Ln
- 4451 Idlewild Ln
- 238 Fenwood Ln
- 4515 Idlewild Ln
- 216 Fenwood Ln
- 4447 Idlewild Ln