Estimated Value: $359,000 - $389,000
4
Beds
2
Baths
1,768
Sq Ft
$212/Sq Ft
Est. Value
About This Home
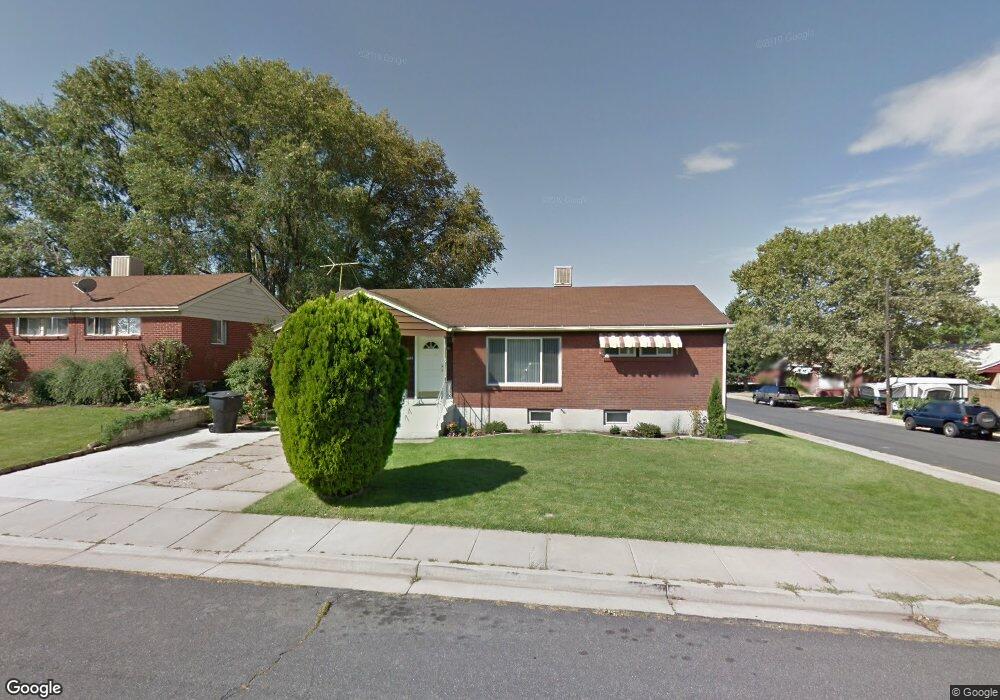
This home is located at 4455 S 375 E, Ogden, UT 84405 and is currently estimated at $375,241, approximately $212 per square foot. 4455 S 375 E is a home located in Weber County with nearby schools including Washington Terrace School, T.H. Bell Junior High School, and Bonneville High School.
Ownership History
Date
Name
Owned For
Owner Type
Purchase Details
Closed on
Nov 30, 2022
Sold by
Rupe Morgan
Bought by
Grow Properties Llc
Current Estimated Value
Purchase Details
Closed on
Feb 1, 2018
Sold by
Reeder Velma M and The Richard & Velma Reeder Tru
Bought by
Rupe Corbin and Rupe Morgan
Home Financials for this Owner
Home Financials are based on the most recent Mortgage that was taken out on this home.
Original Mortgage
$174,600
Interest Rate
3.94%
Mortgage Type
New Conventional
Purchase Details
Closed on
Apr 26, 2002
Sold by
Thompson Velma Mae and Reeder Velma M
Bought by
Reeder Richard and Reeder Velma M
Create a Home Valuation Report for This Property
The Home Valuation Report is an in-depth analysis detailing your home's value as well as a comparison with similar homes in the area
Home Values in the Area
Average Home Value in this Area
Purchase History
| Date | Buyer | Sale Price | Title Company |
|---|---|---|---|
| Grow Properties Llc | -- | -- | |
| Rupe Corbin | -- | Backman Title Services Ltd | |
| Reeder Richard | -- | -- |
Source: Public Records
Mortgage History
| Date | Status | Borrower | Loan Amount |
|---|---|---|---|
| Previous Owner | Rupe Corbin | $174,600 |
Source: Public Records
Tax History
| Year | Tax Paid | Tax Assessment Tax Assessment Total Assessment is a certain percentage of the fair market value that is determined by local assessors to be the total taxable value of land and additions on the property. | Land | Improvement |
|---|---|---|---|---|
| 2025 | $2,508 | $370,482 | $110,006 | $260,476 |
| 2024 | $2,378 | $359,000 | $110,006 | $248,994 |
| 2023 | $2,283 | $344,000 | $109,870 | $234,130 |
| 2022 | $2,383 | $205,700 | $57,750 | $147,950 |
| 2021 | $1,812 | $250,000 | $54,991 | $195,009 |
| 2020 | $1,652 | $206,000 | $45,055 | $160,945 |
| 2019 | $1,620 | $187,000 | $45,055 | $141,945 |
| 2018 | $1,365 | $151,000 | $45,055 | $105,945 |
| 2017 | $1,254 | $128,000 | $29,990 | $98,010 |
| 2016 | $1,135 | $62,288 | $16,560 | $45,728 |
| 2015 | $1,136 | $61,366 | $16,560 | $44,806 |
| 2014 | $1,114 | $59,665 | $16,560 | $43,105 |
Source: Public Records
Map
Nearby Homes
- 291 E 4300 S
- 4579 S 375 E
- 137 Country Club Dr
- 149 Country Club Dr
- 4803 S 350 E
- 4067 Hillcrest Cir
- 4055 Hillcrest Cir
- 4024 S Burch Creek Way
- 4825 Burch Creek Dr
- 4010 S Burch Creek Way
- 4006 S Burch Creek Way
- 239 E Burch Creek Place
- 4014 Porter Ave
- 302 40th St
- 4558 S 300 W
- 241 E Burch Creek Place
- 325 E Chimes View Cir
- 215 40th St
- 4689 S 275 W
- 220 W 4800 S
Your Personal Tour Guide
Ask me questions while you tour the home.