Estimated Value: $279,000 - $341,000
3
Beds
2
Baths
1,844
Sq Ft
$168/Sq Ft
Est. Value
About This Home
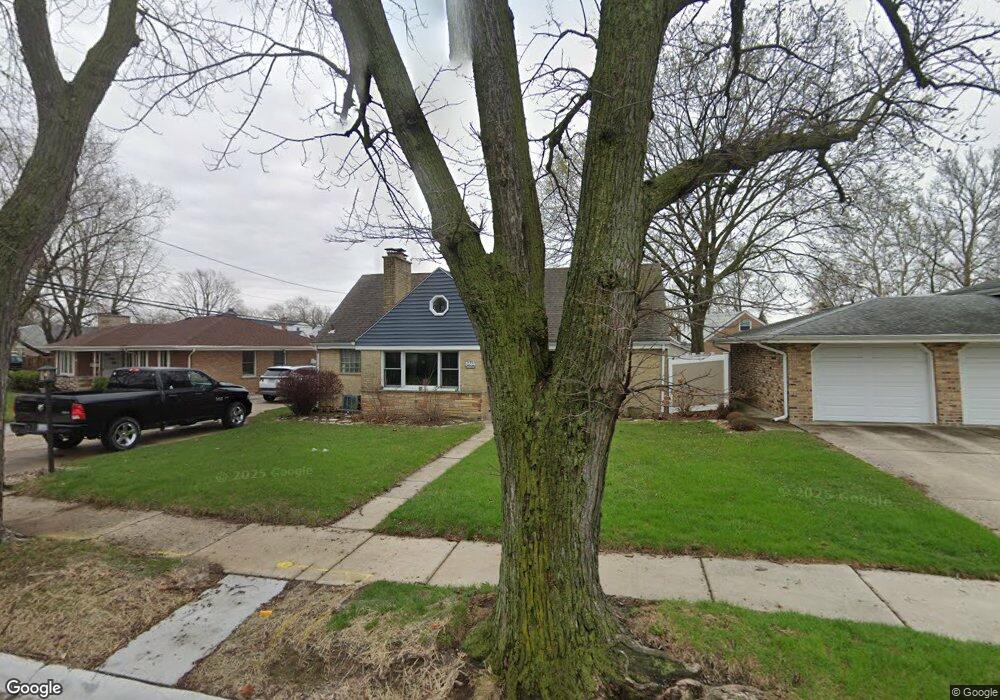
This home is located at 4455 W 115th Place, Alsip, IL 60803 and is currently estimated at $309,125, approximately $167 per square foot. 4455 W 115th Place is a home located in Cook County with nearby schools including Stony Creek Elementary School, Prairie Jr High School, and A B Shepard High School.
Ownership History
Date
Name
Owned For
Owner Type
Purchase Details
Closed on
Nov 20, 2009
Sold by
Delso Daniel B
Bought by
Delso Daniel B and Delso Mardee S
Current Estimated Value
Home Financials for this Owner
Home Financials are based on the most recent Mortgage that was taken out on this home.
Original Mortgage
$175,340
Outstanding Balance
$114,197
Interest Rate
4.95%
Mortgage Type
FHA
Estimated Equity
$194,928
Purchase Details
Closed on
Feb 21, 2001
Sold by
Gniadek Kevin D and Gniadek Julie M
Bought by
Delso Daniel B
Home Financials for this Owner
Home Financials are based on the most recent Mortgage that was taken out on this home.
Original Mortgage
$137,000
Interest Rate
7.18%
Mortgage Type
FHA
Purchase Details
Closed on
Aug 26, 1998
Sold by
Paskewicz Alan and Paskewicz Maureen J
Bought by
Gniadek Kevin D and Gniadek Julie M
Home Financials for this Owner
Home Financials are based on the most recent Mortgage that was taken out on this home.
Original Mortgage
$116,800
Interest Rate
7.03%
Create a Home Valuation Report for This Property
The Home Valuation Report is an in-depth analysis detailing your home's value as well as a comparison with similar homes in the area
Home Values in the Area
Average Home Value in this Area
Purchase History
| Date | Buyer | Sale Price | Title Company |
|---|---|---|---|
| Delso Daniel B | -- | Ticor Title Insurance Co | |
| Delso Daniel B | $143,000 | -- | |
| Gniadek Kevin D | $123,000 | -- |
Source: Public Records
Mortgage History
| Date | Status | Borrower | Loan Amount |
|---|---|---|---|
| Open | Delso Daniel B | $175,340 | |
| Closed | Delso Daniel B | $137,000 | |
| Previous Owner | Gniadek Kevin D | $116,800 | |
| Closed | Delso Daniel B | $3,000 |
Source: Public Records
Tax History Compared to Growth
Tax History
| Year | Tax Paid | Tax Assessment Tax Assessment Total Assessment is a certain percentage of the fair market value that is determined by local assessors to be the total taxable value of land and additions on the property. | Land | Improvement |
|---|---|---|---|---|
| 2024 | $6,191 | $22,000 | $3,863 | $18,137 |
| 2023 | $5,678 | $22,000 | $3,863 | $18,137 |
| 2022 | $5,678 | $17,558 | $3,360 | $14,198 |
| 2021 | $5,435 | $17,557 | $3,359 | $14,198 |
| 2020 | $5,458 | $17,557 | $3,359 | $14,198 |
| 2019 | $5,789 | $18,208 | $3,023 | $15,185 |
| 2018 | $5,571 | $18,208 | $3,023 | $15,185 |
| 2017 | $5,634 | $18,208 | $3,023 | $15,185 |
| 2016 | $4,962 | $15,297 | $2,519 | $12,778 |
| 2015 | $4,874 | $15,297 | $2,519 | $12,778 |
| 2014 | $4,726 | $15,297 | $2,519 | $12,778 |
| 2013 | $4,671 | $16,234 | $2,519 | $13,715 |
Source: Public Records
Map
Nearby Homes
- 11604 S Kenneth Ave
- 11524 S Kildare Ave
- 4317 W Linecrest Dr
- 11625 S Kildare Ave
- 11553 S Joalyce Dr
- 11811 S Tripp Ave
- 11551 S Komensky Ave
- 11720 S Komensky Ave
- 11749 S Karlov Ave
- 11801 S Karlov Ave Unit 303
- 11600 S Lamon Ave
- 11800 S Komensky Ave Unit 203
- 11906 S Cicero Ave
- 11024 Kilpatrick Ave Unit 3
- 12026 S Kildare Ave Unit 16
- 11700 S Springfield Ave
- 10942 S Keeler Ave
- 3836 W 115th Place
- 4343 W 109th St
- 3820 W 117th St
- 11523 S Kilbourn Ave
- 11529 S Kilbourn Ave
- 11535 S Kilbourn Ave
- 11534 S Kenneth Ave
- 11541 S Kilbourn Ave
- 4460 W 115th Place
- 4500 W 115th Place
- 4456 W 115th Place
- 11545 S Kilbourn Ave
- 4506 W 115th Place
- 4444 W 115th Place
- 11544 S Kenneth Ave
- 11524 S Kilbourn Ave
- 4435 W 115th Place
- 4512 W 115th Place
- 11530 S Kilbourn Ave
- 11534 S Kilbourn Ave
- 4438 W 115th Place
- 11540 S Kilbourn Ave
- 11548 S Kenneth Ave