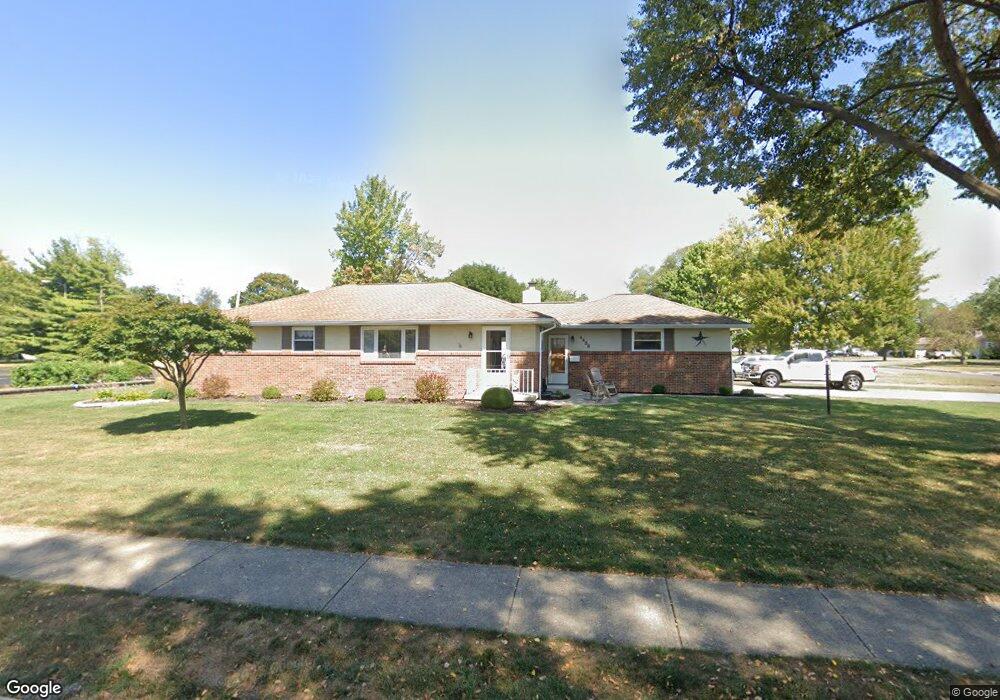
4456 Langley Ave Columbus, OH 43213
Estimated Value: $195,000 - $275,000
3
Beds
2
Baths
1,232
Sq Ft
$186/Sq Ft
Est. Value
About This Home
This home is located at 4456 Langley Ave, Columbus, OH 43213 and is currently estimated at $228,913, approximately $185 per square foot. 4456 Langley Ave is a home located in Franklin County with nearby schools including Etna Road Elementary School, Beechwood Elementary School, and Rosemore Middle School.
Ownership History
Date
Name
Owned For
Owner Type
Purchase Details
Closed on
Feb 26, 2001
Sold by
Vance Paul J
Bought by
Vance Paul J and Vance Connie J
Current Estimated Value
Purchase Details
Closed on
May 4, 1979
Bought by
Vance Paul J
Create a Home Valuation Report for This Property
The Home Valuation Report is an in-depth analysis detailing your home's value as well as a comparison with similar homes in the area
Home Values in the Area
Average Home Value in this Area
Purchase History
| Date | Buyer | Sale Price | Title Company |
|---|---|---|---|
| Vance Paul J | -- | Bexley Title Agency Inc | |
| Vance Paul J | -- | -- |
Source: Public Records
Tax History
| Year | Tax Paid | Tax Assessment Tax Assessment Total Assessment is a certain percentage of the fair market value that is determined by local assessors to be the total taxable value of land and additions on the property. | Land | Improvement |
|---|---|---|---|---|
| 2025 | $3,021 | $78,900 | $18,170 | $60,730 |
| 2024 | $3,021 | $78,900 | $18,170 | $60,730 |
| 2023 | $3,026 | $78,890 | $18,165 | $60,725 |
| 2022 | $2,207 | $47,400 | $8,930 | $38,470 |
| 2021 | $2,073 | $47,400 | $8,930 | $38,470 |
| 2020 | $2,052 | $47,400 | $8,930 | $38,470 |
| 2019 | $1,783 | $37,940 | $7,140 | $30,800 |
| 2018 | $908 | $37,940 | $7,140 | $30,800 |
| 2017 | $1,722 | $37,940 | $7,140 | $30,800 |
| 2016 | $1,980 | $39,070 | $6,900 | $32,170 |
| 2015 | $999 | $39,070 | $6,900 | $32,170 |
| 2014 | $1,998 | $39,070 | $6,900 | $32,170 |
| 2013 | $1,086 | $43,400 | $7,665 | $35,735 |
Source: Public Records
Map
Nearby Homes
- 706 Ross Rd
- 745 Pierce Ave
- 4662 Jae Ave
- 695 Erickson Ave
- 491 Westphal Ave
- 798 S Yearling Rd
- 1085 S Hamilton Rd
- 4174 Wright Park
- 4481 Chandler Dr
- 963 Erickson Ave
- 4413 Broadhurst Dr
- 4212 Seigman Ave
- 431 Cumberland Dr
- 957 Rose Place
- 845 Exeter Rd
- 1193 Marble Dr
- 4517 Saint Rita Ln
- 4148 Elbern Ave
- 1229 Simpson Dr
- 4117 Elbern Ave
Your Personal Tour Guide
Ask me questions while you tour the home.