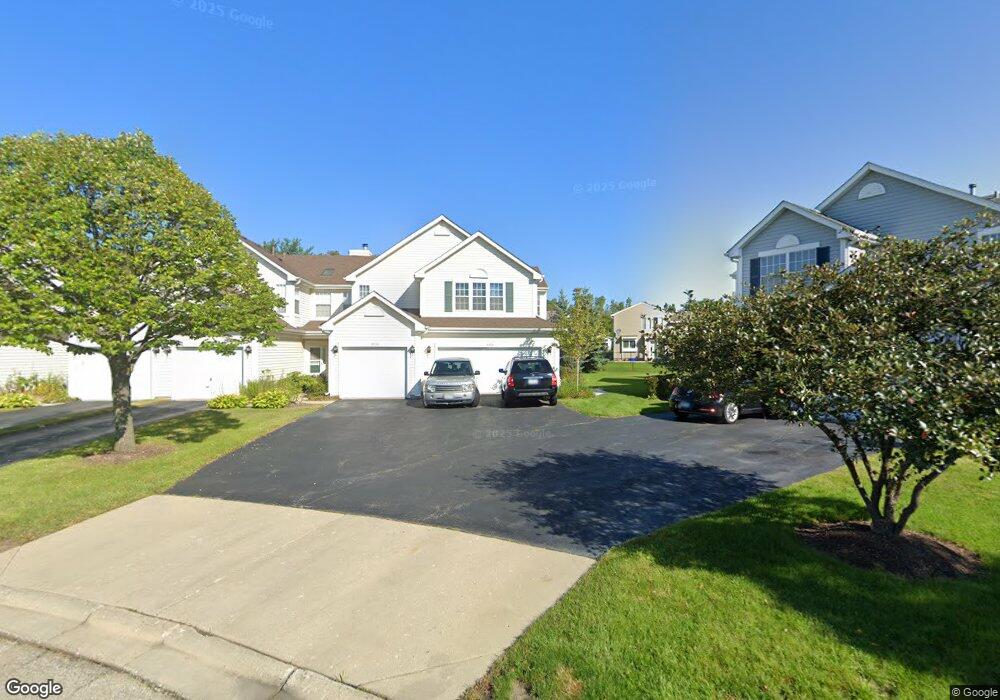
4456 W Quill Ln Waukegan, IL 60085
Southwest Waukegan NeighborhoodEstimated Value: $245,000 - $266,000
2
Beds
3
Baths
1,486
Sq Ft
$169/Sq Ft
Est. Value
About This Home
This home is located at 4456 W Quill Ln, Waukegan, IL 60085 and is currently estimated at $251,781, approximately $169 per square foot. 4456 W Quill Ln is a home located in Lake County with nearby schools including Woodland Primary School, Woodland Elementary School, and Woodland Intermediate School.
Ownership History
Date
Name
Owned For
Owner Type
Purchase Details
Closed on
Jan 24, 2019
Sold by
Rosborough Philip A
Bought by
Revocab Rosborough Catherine D and Catherine D Rosborough Revocable Trust
Current Estimated Value
Purchase Details
Closed on
Dec 20, 2005
Sold by
Klabisch Michael C and Klabisch Debbie L
Bought by
Rosborough Philip A
Home Financials for this Owner
Home Financials are based on the most recent Mortgage that was taken out on this home.
Original Mortgage
$155,200
Outstanding Balance
$82,711
Interest Rate
5.5%
Mortgage Type
Unknown
Estimated Equity
$169,070
Purchase Details
Closed on
Nov 15, 1995
Sold by
Pinnacle Corp
Bought by
Klabisch Michael C and Klabisch Debbie L
Home Financials for this Owner
Home Financials are based on the most recent Mortgage that was taken out on this home.
Original Mortgage
$131,250
Interest Rate
7.65%
Mortgage Type
FHA
Create a Home Valuation Report for This Property
The Home Valuation Report is an in-depth analysis detailing your home's value as well as a comparison with similar homes in the area
Home Values in the Area
Average Home Value in this Area
Purchase History
| Date | Buyer | Sale Price | Title Company |
|---|---|---|---|
| Revocab Rosborough Catherine D | -- | None Available | |
| Rosborough Philip A | $194,000 | Fort Dearborn Land Title | |
| Klabisch Michael C | $138,500 | -- |
Source: Public Records
Mortgage History
| Date | Status | Borrower | Loan Amount |
|---|---|---|---|
| Open | Rosborough Philip A | $155,200 | |
| Previous Owner | Klabisch Michael C | $131,250 |
Source: Public Records
Tax History Compared to Growth
Tax History
| Year | Tax Paid | Tax Assessment Tax Assessment Total Assessment is a certain percentage of the fair market value that is determined by local assessors to be the total taxable value of land and additions on the property. | Land | Improvement |
|---|---|---|---|---|
| 2024 | $7,171 | $62,757 | $8,975 | $53,782 |
| 2023 | $6,785 | $58,265 | $8,333 | $49,932 |
| 2022 | $6,785 | $54,954 | $7,034 | $47,920 |
| 2021 | $6,085 | $50,720 | $6,492 | $44,228 |
| 2020 | $5,994 | $49,473 | $6,332 | $43,141 |
| 2019 | $5,922 | $48,037 | $6,148 | $41,889 |
| 2018 | $5,353 | $43,237 | $6,047 | $37,190 |
| 2017 | $5,315 | $41,998 | $5,874 | $36,124 |
| 2016 | $5,268 | $40,128 | $5,612 | $34,516 |
| 2015 | $5,232 | $38,057 | $5,322 | $32,735 |
| 2014 | $6,898 | $37,542 | $5,249 | $32,293 |
| 2012 | $6,398 | $51,227 | $5,290 | $45,937 |
Source: Public Records
Map
Nearby Homes
- 4482 W Tucker Ln
- 4390 W Parkway Ave
- 4520 W Lawn Ave
- 1677 S Candlestick Way Unit 3313
- 4437-4495 W Kennedy Dr
- 4363 W Kennedy Dr
- 601 Lakehurst Rd
- 662 Waterbury Ave
- 33564 Greenleaf St
- 14314 Towne Trail
- 543 Long Hill Rd
- 450 Tanglewood Dr
- 4829 Kings Way W
- 0 Northwoods Ave Unit MRD11938775
- 00 Northwood Ave
- 3810 1st St
- 14875 Creekside Path
- 334 Concord Square
- 424 Greenview Dr
- 31366 W Somerset Cir
- 4402 W Quill Ln
- 4420 W Quill Ln
- 4440 W Quill Ln
- 4444 W Quill Ln
- 4458 W Quill Ln
- 4468 W Quill Ln
- 4502 W Quill Ln
- 4510 W Quill Ln
- 4388 W Brownstone Way
- 4390 W Brownstone Way
- 4392 W Brownstone Way
- 4394 W Brownstone Way
- 4396 W Brownstone Way
- 4398 W Brownstone Way
- 4404 W Quill Ln
- 4406 W Quill Ln
- 4408 W Quill Ln
- 4410 W Quill Ln
- 4416 W Quill Ln
- 4418 W Quill Ln