4457 Parkview Dr Unit 2 Lithia Springs, GA 30122
Lithia Springs NeighborhoodEstimated Value: $238,000 - $248,000
3
Beds
2
Baths
1,365
Sq Ft
$177/Sq Ft
Est. Value
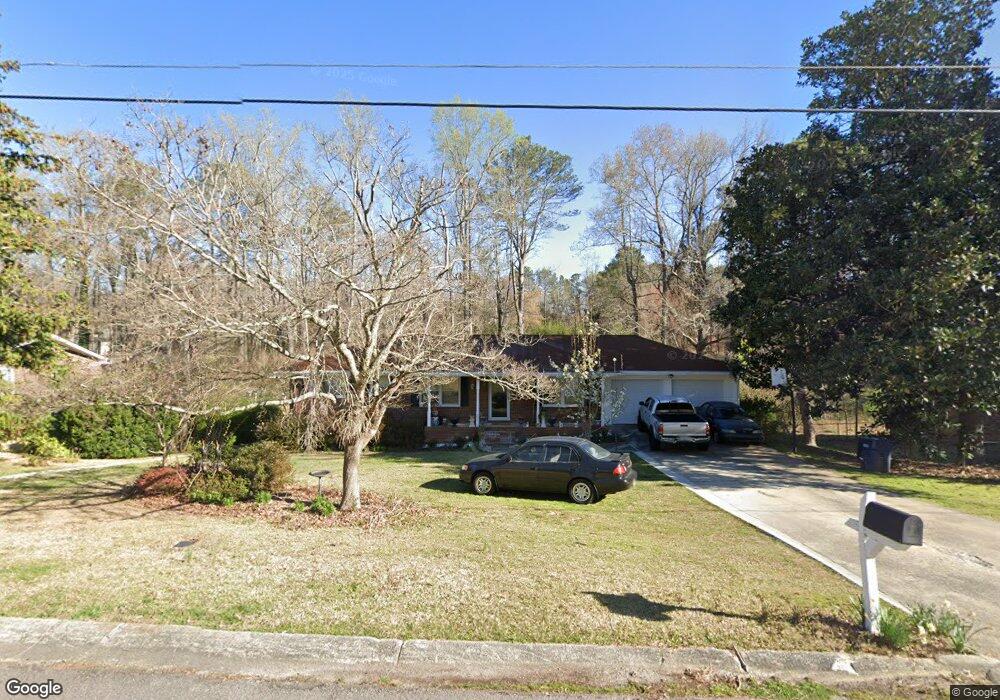
About This Home
This home is located at 4457 Parkview Dr Unit 2, Lithia Springs, GA 30122 and is currently estimated at $241,770, approximately $177 per square foot. 4457 Parkview Dr Unit 2 is a home located in Douglas County with nearby schools including Lithia Springs Elementary School, Turner Middle School, and Lithia Springs Comprehensive High School.
Ownership History
Date
Name
Owned For
Owner Type
Purchase Details
Closed on
Dec 12, 2003
Sold by
Jwr Investment Grp Llc
Bought by
Gonzalez Lino
Current Estimated Value
Home Financials for this Owner
Home Financials are based on the most recent Mortgage that was taken out on this home.
Original Mortgage
$106,700
Outstanding Balance
$49,236
Interest Rate
5.82%
Mortgage Type
New Conventional
Estimated Equity
$192,534
Purchase Details
Closed on
Apr 18, 2001
Sold by
Payne Chris B
Bought by
Mcneil Thommas D
Home Financials for this Owner
Home Financials are based on the most recent Mortgage that was taken out on this home.
Original Mortgage
$100,424
Interest Rate
7.08%
Mortgage Type
FHA
Purchase Details
Closed on
Sep 29, 2000
Sold by
Juhlin Kathryn P
Bought by
Payne Chris B
Home Financials for this Owner
Home Financials are based on the most recent Mortgage that was taken out on this home.
Original Mortgage
$56,000
Interest Rate
7.83%
Mortgage Type
New Conventional
Create a Home Valuation Report for This Property
The Home Valuation Report is an in-depth analysis detailing your home's value as well as a comparison with similar homes in the area
Home Values in the Area
Average Home Value in this Area
Purchase History
| Date | Buyer | Sale Price | Title Company |
|---|---|---|---|
| Gonzalez Lino | $106,700 | -- | |
| Mcneil Thommas D | $102,000 | -- | |
| Payne Chris B | $70,000 | -- |
Source: Public Records
Mortgage History
| Date | Status | Borrower | Loan Amount |
|---|---|---|---|
| Open | Gonzalez Lino | $106,700 | |
| Previous Owner | Mcneil Thommas D | $100,424 | |
| Previous Owner | Payne Chris B | $56,000 |
Source: Public Records
Tax History Compared to Growth
Tax History
| Year | Tax Paid | Tax Assessment Tax Assessment Total Assessment is a certain percentage of the fair market value that is determined by local assessors to be the total taxable value of land and additions on the property. | Land | Improvement |
|---|---|---|---|---|
| 2024 | $2,196 | $93,560 | $22,400 | $71,160 |
| 2023 | $2,196 | $93,560 | $22,400 | $71,160 |
| 2022 | $1,903 | $75,280 | $18,560 | $56,720 |
| 2021 | $1,540 | $57,000 | $15,240 | $41,760 |
| 2020 | $1,526 | $54,840 | $13,080 | $41,760 |
| 2019 | $1,431 | $53,760 | $13,080 | $40,680 |
| 2018 | $1,274 | $45,880 | $11,400 | $34,480 |
| 2017 | $1,201 | $41,360 | $11,400 | $29,960 |
| 2016 | $1,072 | $36,560 | $10,320 | $26,240 |
| 2015 | $1,189 | $39,440 | $11,520 | $27,920 |
| 2014 | $938 | $31,280 | $9,600 | $21,680 |
| 2013 | -- | $30,920 | $9,600 | $21,320 |
Source: Public Records
Map
Nearby Homes
- 7163 Bluebird Ln
- 4485 Canary Ct
- 7144 Carolyn Cir
- 4336 Parkview Dr
- 4319 Parkview Dr
- 4365 Clare Ln
- 7146 Old Beulah Rd
- 0 Mckown Rd Unit 7632191
- 0 Mckown Rd Unit 10583796
- 6807 Tralee Dr
- 6776 Tralee Dr Unit 1
- 3916 S Martin Way
- 540 Boulder Park Dr
- 11041 Veterans Memorial Hwy
- 6906 Cherry Cir
- 4361 Ben Hill Rd
- 3295 Stoneybrook Dr
- 4445 Parkview Dr Unit 2
- 4471 Parkview Dr
- 4433 Parkview Dr
- 4460 Parkview Dr
- 4485 Parkview Dr
- 4432 Parkview Dr
- 4482 Parkview Dr
- 4423 Parkview Dr
- 7101 Tulip Dr
- 4416 Parkview Dr Unit 2
- 4411 Parkview Dr
- 7100 Bluebird Ln
- 7113 Tulip Dr
- 7065 Bluebird Ln
- 7053 Bluebird Ln
- 7075 Bluebird Ln
- 4417 Canary Ct
- 4417 Canary Ct Unit 3
- 4474 Donegal Cir
- 4399 Parkview Dr