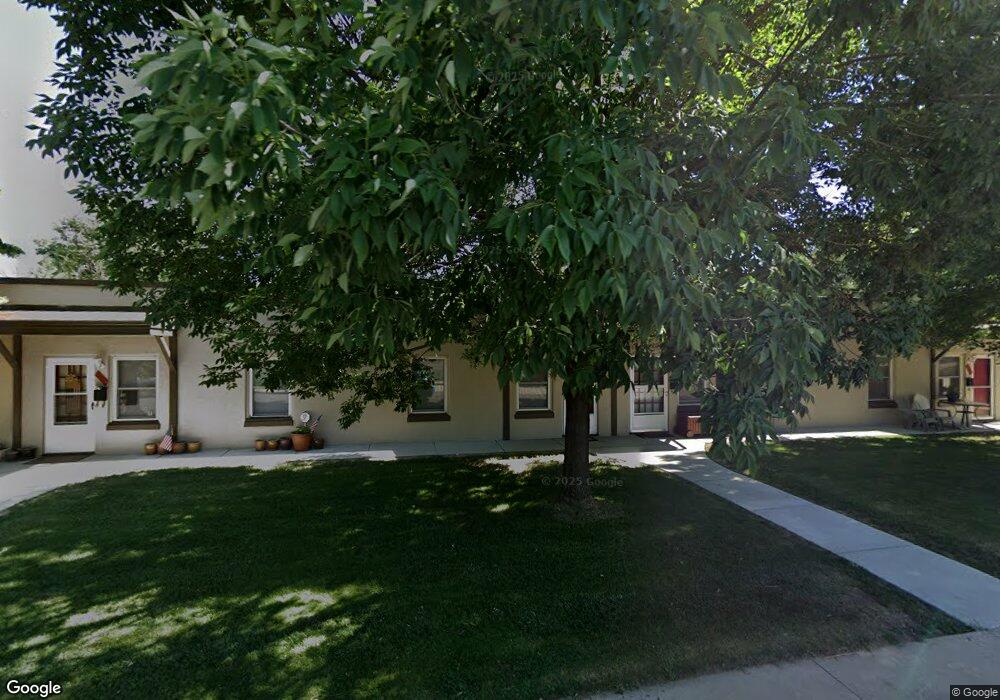
4458 W 27th Ave Unit 4458 Denver, CO 80212
Sloan Lake NeighborhoodEstimated Value: $310,000 - $356,530
2
Beds
1
Bath
590
Sq Ft
$563/Sq Ft
Est. Value
About This Home
This home is located at 4458 W 27th Ave Unit 4458, Denver, CO 80212 and is currently estimated at $332,383, approximately $563 per square foot. 4458 W 27th Ave Unit 4458 is a home located in Denver County with nearby schools including Brown International Academy, Bryant Webster Dual Language School, and Skinner Middle School.
Ownership History
Date
Name
Owned For
Owner Type
Purchase Details
Closed on
Mar 6, 2015
Sold by
Cartwright Jason A and Cartwright Jessie R
Bought by
Lynch Margaret E and Rhodes Roxanne
Current Estimated Value
Purchase Details
Closed on
Sep 21, 2004
Sold by
Brown Alexandra C
Bought by
Cartwright Jason A and Whipple Jessie R
Home Financials for this Owner
Home Financials are based on the most recent Mortgage that was taken out on this home.
Original Mortgage
$121,353
Interest Rate
5.86%
Mortgage Type
FHA
Purchase Details
Closed on
Jun 16, 2000
Sold by
D M L Llc
Bought by
Brown Alexandra C
Home Financials for this Owner
Home Financials are based on the most recent Mortgage that was taken out on this home.
Original Mortgage
$96,900
Interest Rate
8.5%
Create a Home Valuation Report for This Property
The Home Valuation Report is an in-depth analysis detailing your home's value as well as a comparison with similar homes in the area
Home Values in the Area
Average Home Value in this Area
Purchase History
| Date | Buyer | Sale Price | Title Company |
|---|---|---|---|
| Lynch Margaret E | -- | None Available | |
| Cartwright Jason A | $134,900 | -- | |
| Brown Alexandra C | $99,900 | Land Title Guarantee Company |
Source: Public Records
Mortgage History
| Date | Status | Borrower | Loan Amount |
|---|---|---|---|
| Previous Owner | Cartwright Jason A | $121,353 | |
| Previous Owner | Brown Alexandra C | $96,900 | |
| Closed | Cartwright Jason A | $3,640 |
Source: Public Records
Tax History
| Year | Tax Paid | Tax Assessment Tax Assessment Total Assessment is a certain percentage of the fair market value that is determined by local assessors to be the total taxable value of land and additions on the property. | Land | Improvement |
|---|---|---|---|---|
| 2025 | $1,518 | $26,380 | $17,690 | $17,690 |
| 2024 | $1,518 | $19,160 | $9,320 | $9,840 |
| 2023 | $1,485 | $19,160 | $9,320 | $9,840 |
| 2022 | $1,521 | $19,120 | $9,450 | $9,670 |
| 2021 | $1,468 | $19,670 | $9,720 | $9,950 |
| 2020 | $1,370 | $18,470 | $9,020 | $9,450 |
| 2019 | $1,332 | $18,470 | $9,020 | $9,450 |
| 2018 | $1,238 | $16,000 | $6,030 | $9,970 |
| 2017 | $1,234 | $16,000 | $6,030 | $9,970 |
| 2016 | $862 | $10,570 | $6,002 | $4,568 |
| 2015 | $826 | $10,570 | $6,002 | $4,568 |
| 2014 | $698 | $8,400 | $5,405 | $2,995 |
Source: Public Records
Map
Nearby Homes
- 4528 W 27th Ave
- 2727 Tennyson St
- 2601 Stuart St
- 2710 Zenobia St
- 4041 W Hayward Place
- 3930 W Byron Place
- 3924 W 29th Ave
- 3915 W Byron Place
- 2912 Perry St
- 2325 Perry St
- 5128 W 26th Ave Unit 208
- 5128 W 26th Ave Unit 205
- 5128 W 26th Ave Unit 209
- 5128 W 26th Ave Unit 310
- 5128 W 26th Ave Unit 312
- 5128 W 26th Ave Unit 104
- 5128 W 26th Ave Unit 102
- 2201 Quitman St
- 5125 W 29th Ave Unit 6
- 5125 W 29th Ave Unit 1
- 4466 W 27th Ave Unit 4466
- 4462 W 27th Ave Unit 4462
- 4454 W 27th Ave Unit 4454
- 2684 Utica St Unit 2684
- 2680 Utica St Unit 2680
- 2676 Utica St Unit 2676
- 2672 Utica St Unit 2672
- 2668 Utica St Unit 2668
- 2664 Utica St Unit 2664
- 2660 Utica St Unit 2660
- 2688 Utica St Unit 2688
- 2662 Utica St Unit 2662
- 2632 Utica St Unit 2632
- 2628 Utica St Unit 2628
- 2624 Utica St Unit 2624
- 2610 Utica St
- 2620 Utica St Unit 2620
- 2616 Utica St Unit 2616
- 4450 W 27th Ave
- 4450 W 27th Ave Unit 4450
Your Personal Tour Guide
Ask me questions while you tour the home.