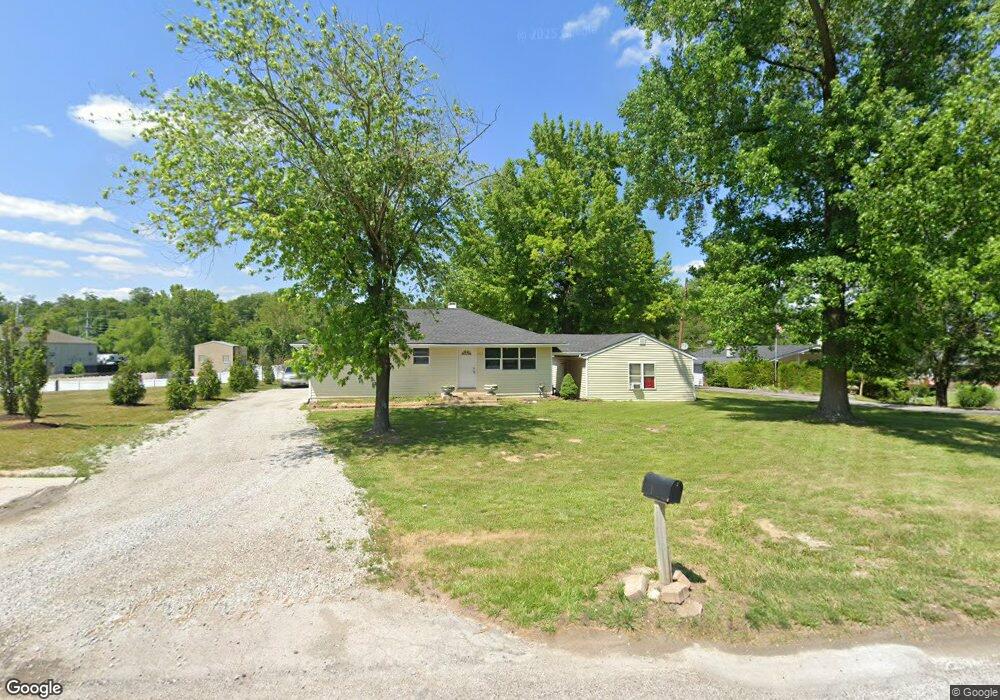
4459 Baumgartner Rd Saint Louis, MO 63129
Estimated Value: $224,000 - $300,000
3
Beds
1
Bath
1,120
Sq Ft
$224/Sq Ft
Est. Value
About This Home
This home is located at 4459 Baumgartner Rd, Saint Louis, MO 63129 and is currently estimated at $250,414, approximately $223 per square foot. 4459 Baumgartner Rd is a home located in St. Louis County with nearby schools including Blades Elementary School, Bernard Middle School, and Oakville Senior High School.
Ownership History
Date
Name
Owned For
Owner Type
Purchase Details
Closed on
Oct 3, 2025
Sold by
Michael V Moore Living Trust and Moore Michael P
Bought by
Jimenez Jaime
Current Estimated Value
Home Financials for this Owner
Home Financials are based on the most recent Mortgage that was taken out on this home.
Original Mortgage
$228,000
Outstanding Balance
$227,178
Interest Rate
6.56%
Mortgage Type
New Conventional
Estimated Equity
$23,236
Purchase Details
Closed on
Mar 31, 2025
Sold by
Michael V Moore Living Trust and Moore Pamela J
Bought by
Moore Michael P and Moore Patricia N
Purchase Details
Closed on
Nov 15, 2001
Sold by
Ruegge David W and Ruegge Linda K
Bought by
Moore Michael and Moore Pamela J
Purchase Details
Closed on
Oct 23, 2001
Sold by
Wells Fargo Home Mtg Inc
Bought by
Garnto Ryan
Purchase Details
Closed on
Sep 8, 2000
Sold by
Ruegge John H and Ruegge Cindy
Bought by
Ruegge David W and Ruegge Linda
Create a Home Valuation Report for This Property
The Home Valuation Report is an in-depth analysis detailing your home's value as well as a comparison with similar homes in the area
Home Values in the Area
Average Home Value in this Area
Purchase History
| Date | Buyer | Sale Price | Title Company |
|---|---|---|---|
| Jimenez Jaime | -- | None Listed On Document | |
| Moore Michael P | -- | None Listed On Document | |
| Moore Michael P | -- | None Listed On Document | |
| Moore Michael | $135,000 | -- | |
| Garnto Ryan | -- | -- | |
| Ruegge David W | $47,000 | Archway Title Agency Inc | |
| Ruegge David W | -- | Archway Title Agency Inc |
Source: Public Records
Mortgage History
| Date | Status | Borrower | Loan Amount |
|---|---|---|---|
| Open | Jimenez Jaime | $228,000 |
Source: Public Records
Tax History
| Year | Tax Paid | Tax Assessment Tax Assessment Total Assessment is a certain percentage of the fair market value that is determined by local assessors to be the total taxable value of land and additions on the property. | Land | Improvement |
|---|---|---|---|---|
| 2025 | $2,056 | $35,250 | $17,100 | $18,150 |
| 2024 | $2,056 | $30,420 | $17,100 | $13,320 |
| 2023 | $2,056 | $30,420 | $17,100 | $13,320 |
| 2022 | $1,644 | $24,680 | $13,680 | $11,000 |
| 2021 | $1,591 | $24,680 | $13,680 | $11,000 |
| 2020 | $1,671 | $24,680 | $9,500 | $15,180 |
| 2019 | $1,666 | $24,680 | $9,500 | $15,180 |
| 2018 | $1,671 | $22,350 | $10,170 | $12,180 |
| 2017 | $1,669 | $22,350 | $10,170 | $12,180 |
| 2016 | $1,738 | $22,350 | $10,170 | $12,180 |
| 2015 | $1,597 | $22,350 | $10,170 | $12,180 |
| 2014 | $1,469 | $20,330 | $4,710 | $15,620 |
Source: Public Records
Map
Nearby Homes
- 5839 Brookstone Terrace Dr
- 4121 Old Baumgartner Rd
- 0 Hollywood Beach Rd
- 4694 Baumgartner Rd
- 5850 Birchmont Place Dr
- 5735 Dove Meadow Ln
- 3600 Old Baumgartner Rd
- 5908 Oakville Woods Place
- 3702 Yaeger Rd
- 5646 Dove Meadow Ln
- 3714 Pinon Pine Ct
- 423 Kathryn Dr
- 3634 Coffee Tree Ct
- 447 Mabel Dr
- 447 June Dr
- 475 Oye Dr
- 490 Electra Dr
- 5939 Stephanie Green Ct
- 477 Keller Dr
- 5581 Baronridge Dr Unit 5
- 4447 Baumgartner Rd
- 4471 Baumgartner Rd
- 4472 Baumgartner Rd
- 4435 Baumgartner Rd
- 4444 Baumgartner Rd
- 4484 Baumgartner Rd
- 4423 Baumgartner Rd
- 4600 Baumgartner Rd
- 4410 Baumgartner Rd
- 4615 Baumgartner Rd
- 4616 Baumgartner Rd
- 4638 Baumgartner Rd
- 4406 Baumgartner Rd
- 4639 Baumgartner Rd
- 4512 Old Baumgartner Rd
- 4516 Old Baumgartner Rd
- 4409 Baumgartner Rd
- 4520 Old Baumgartner Rd
- 4651 Baumgartner Rd
- 4507 Old Baumgartner Rd
Your Personal Tour Guide
Ask me questions while you tour the home.