Estimated Value: $111,000 - $209,000
3
Beds
1
Bath
1,040
Sq Ft
$164/Sq Ft
Est. Value
About This Home
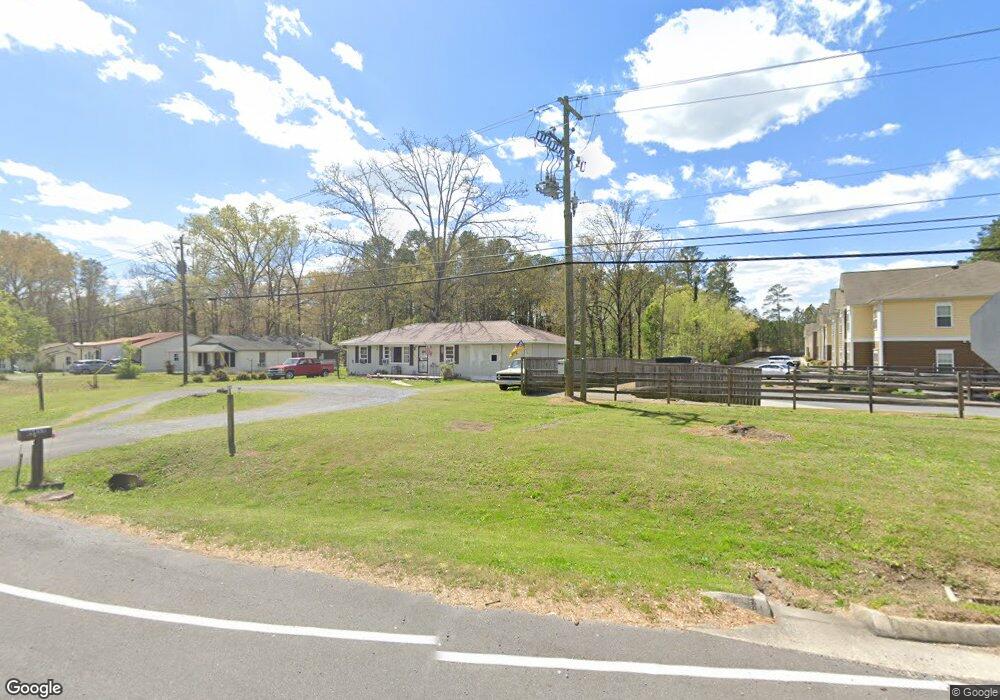
This home is located at 4459 Martha Berry Hwy NW, Rome, GA 30165 and is currently estimated at $170,440, approximately $163 per square foot. 4459 Martha Berry Hwy NW is a home located in Floyd County with nearby schools including Armuchee Middle School and Armuchee High School.
Ownership History
Date
Name
Owned For
Owner Type
Purchase Details
Closed on
Aug 16, 2005
Sold by
Klh Pest Control Llc
Bought by
Barmore Beverly
Current Estimated Value
Home Financials for this Owner
Home Financials are based on the most recent Mortgage that was taken out on this home.
Original Mortgage
$72,000
Interest Rate
5.64%
Mortgage Type
New Conventional
Purchase Details
Closed on
Mar 9, 2004
Sold by
Greene Ruth B
Bought by
Klh Pest Control Llc
Purchase Details
Closed on
Jun 3, 1999
Sold by
Geraldson Lucy E and Geraldson Stanley R
Bought by
Greene Ruth B
Purchase Details
Closed on
Feb 7, 1994
Bought by
P and R
Purchase Details
Closed on
Feb 4, 1994
Sold by
King Reba
Bought by
Geraldson Lucy E and Gerald Stanley R
Purchase Details
Closed on
Jun 28, 1984
Sold by
Bee Hive Day Care Center
Bought by
King Reba
Purchase Details
Closed on
Nov 30, 1974
Bought by
Bee Hive Day Care Center
Create a Home Valuation Report for This Property
The Home Valuation Report is an in-depth analysis detailing your home's value as well as a comparison with similar homes in the area
Home Values in the Area
Average Home Value in this Area
Purchase History
| Date | Buyer | Sale Price | Title Company |
|---|---|---|---|
| Barmore Beverly | $52,018 | -- | |
| Klh Pest Control Llc | $63,000 | -- | |
| Greene Ruth B | $40,000 | -- | |
| P | -- | -- | |
| Geraldson Lucy E | $30,000 | -- | |
| King Reba | $15,000 | -- | |
| Bee Hive Day Care Center | $15,000 | -- |
Source: Public Records
Mortgage History
| Date | Status | Borrower | Loan Amount |
|---|---|---|---|
| Closed | Barmore Beverly | $72,000 |
Source: Public Records
Tax History Compared to Growth
Tax History
| Year | Tax Paid | Tax Assessment Tax Assessment Total Assessment is a certain percentage of the fair market value that is determined by local assessors to be the total taxable value of land and additions on the property. | Land | Improvement |
|---|---|---|---|---|
| 2024 | $1,594 | $30,338 | $4,154 | $26,184 |
| 2023 | $868 | $29,285 | $3,776 | $25,509 |
| 2022 | $723 | $24,383 | $3,021 | $21,362 |
| 2021 | $677 | $22,434 | $3,021 | $19,413 |
| 2020 | $633 | $20,792 | $2,266 | $18,526 |
| 2019 | $508 | $19,888 | $2,266 | $17,622 |
| 2018 | $799 | $26,568 | $2,266 | $24,302 |
| 2017 | $778 | $25,808 | $2,266 | $23,542 |
| 2016 | $813 | $26,638 | $2,240 | $24,398 |
| 2015 | $795 | $26,638 | $2,240 | $24,398 |
| 2014 | $795 | $26,638 | $2,240 | $24,398 |
Source: Public Records
Map
Nearby Homes
- 67 Dixie Park Rd NW
- Tupelo Plan at Summer Club
- Elder Plan at Summer Club
- Hazel Plan at Summer Club
- Spruce Plan at Summer Club
- Cedar Plan at Summer Club
- 13&15 Crabapple Ln
- 13 & 15 Crabapple Ln NW
- 10 Summer Club Blvd NW
- 16 Quarter Horse Dr NW
- 8 Silverbell Ln
- PEARSON Plan at Old Summerville Village
- 4 Silverbell Ln
- 12 Silverbell Ln
- 10 Silverbell Ln
- 15 Silverbell Ln NW
- 8 Walking Horse Dr NW
- 30 Silverbell Ln NW
- 14 Meadowood Dr NW
- 4449 Martha Berry Hwy NW
- 4441 Martha Berry Hwy NW
- 4469 Martha Berry Hwy NW
- 4433 Martha Berry Hwy NW
- 4433 Martha Berry Hwy NW
- 4447 Martha Berry Hwy NW
- 4491 Martha Berry Hwy NW
- 4472 Martha Berry Hwy
- 4443 Martha Berry Hwy NW
- 4424 Martha Berry Hwy NE
- 4501 Martha Berry Hwy
- 4425 Martha Berry Hwy NW
- 4511 Martha Berry Hwy NW
- 114 Baby Doe Dr NW Unit A&B
- 114 Baby Doe Dr NW
- 4 Dixie Park Rd NE
- 112 Baby Doe Dr NW Unit 13
- 116 Baby Doe Dr NW
- 116 Baby Doe Dr NW
- 4400 Martha Berry Hwy NE