Estimated Value: $383,000 - $390,800
4
Beds
2
Baths
2,100
Sq Ft
$184/Sq Ft
Est. Value
About This Home
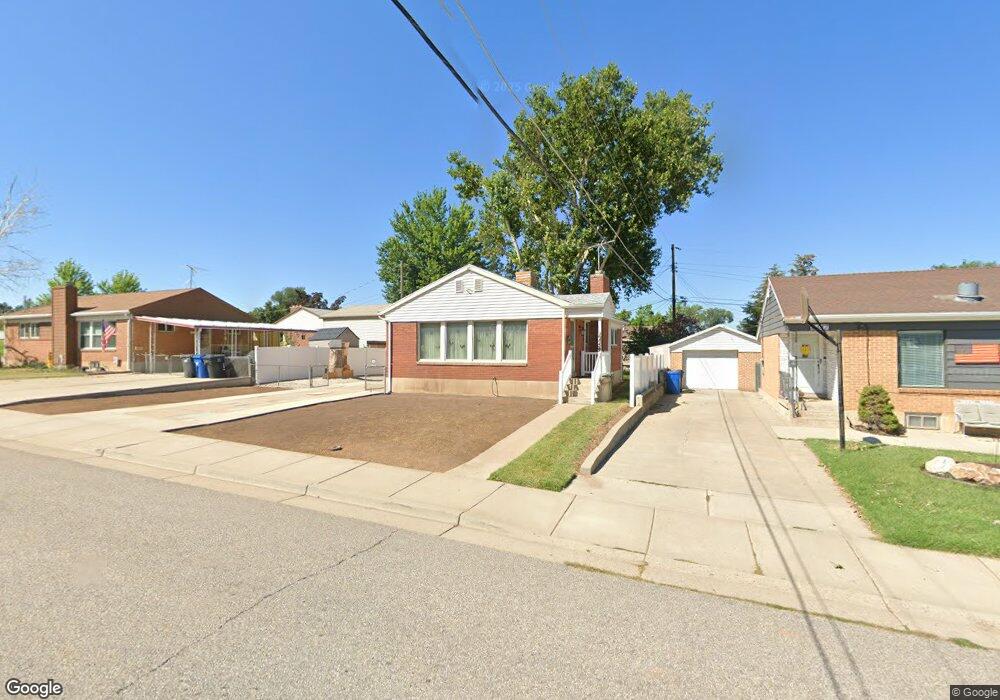
This home is located at 4459 S 100 W, Ogden, UT 84405 and is currently estimated at $386,950, approximately $184 per square foot. 4459 S 100 W is a home located in Weber County with nearby schools including Washington Terrace School, T.H. Bell Junior High School, and Bonneville High School.
Ownership History
Date
Name
Owned For
Owner Type
Purchase Details
Closed on
Sep 29, 2017
Sold by
Lacey Ron Scott and Selly Karen Lacey
Bought by
Crocker Karren
Current Estimated Value
Home Financials for this Owner
Home Financials are based on the most recent Mortgage that was taken out on this home.
Original Mortgage
$193,000
Outstanding Balance
$161,125
Interest Rate
3.89%
Mortgage Type
VA
Estimated Equity
$225,825
Purchase Details
Closed on
Aug 16, 2017
Sold by
Lacey Ron Scott and Lacey Leta Schenk
Bought by
Lacey Ron Scott
Home Financials for this Owner
Home Financials are based on the most recent Mortgage that was taken out on this home.
Original Mortgage
$193,000
Outstanding Balance
$161,125
Interest Rate
3.89%
Mortgage Type
VA
Estimated Equity
$225,825
Purchase Details
Closed on
Sep 17, 2014
Sold by
Lacey Don Linford
Bought by
Lacey Don Linford and Lacey Family Trust
Create a Home Valuation Report for This Property
The Home Valuation Report is an in-depth analysis detailing your home's value as well as a comparison with similar homes in the area
Home Values in the Area
Average Home Value in this Area
Purchase History
| Date | Buyer | Sale Price | Title Company |
|---|---|---|---|
| Crocker Karren | -- | Access Title Co | |
| Crocker Kareen | -- | Access Title Co | |
| Lacey Ron Scott | -- | None Available | |
| Lacey Don Linford | -- | None Available |
Source: Public Records
Mortgage History
| Date | Status | Borrower | Loan Amount |
|---|---|---|---|
| Open | Crocker Kareen | $193,000 | |
| Closed | Crocker Kareen | $193,000 |
Source: Public Records
Tax History Compared to Growth
Tax History
| Year | Tax Paid | Tax Assessment Tax Assessment Total Assessment is a certain percentage of the fair market value that is determined by local assessors to be the total taxable value of land and additions on the property. | Land | Improvement |
|---|---|---|---|---|
| 2025 | $2,617 | $389,311 | $110,006 | $279,305 |
| 2024 | $1,405 | $376,999 | $110,006 | $266,993 |
| 2023 | $1,284 | $341,000 | $109,870 | $231,130 |
| 2022 | $2,479 | $390,999 | $105,000 | $285,999 |
| 2021 | $270 | $269,000 | $54,991 | $214,009 |
| 2020 | $263 | $245,000 | $45,055 | $199,945 |
| 2019 | $263 | $215,000 | $45,055 | $169,945 |
| 2018 | $1,651 | $190,000 | $45,055 | $144,945 |
| 2017 | $1,449 | $153,000 | $29,990 | $123,010 |
| 2016 | $1,305 | $74,259 | $16,560 | $57,699 |
| 2015 | $1,320 | $74,008 | $16,560 | $57,448 |
| 2014 | $229 | $72,414 | $16,560 | $55,854 |
Source: Public Records
Map
Nearby Homes
- 4360 S 275 W
- 235 W 4600 S
- 4610 S 250 W
- 193 W 4650 S
- 4506 S 300 W
- 325 E 4425 S
- 358 W 4575 S
- 291 E 4300 S
- 396 W 4675 S
- 149 Country Club Dr
- 131 Country Club Dr
- 4617 S 450 W
- 4803 S 350 E
- 4856 S 300 W
- 13 Yale Dr
- 4694 S Ridgeline Dr
- 4477 Porter Ave
- 203 W 4900 S Unit 3
- 4067 Hillcrest Cir
- 4055 Hillcrest Cir