Estimated Value: $385,000 - $430,000
3
Beds
3
Baths
2,805
Sq Ft
$142/Sq Ft
Est. Value
About This Home
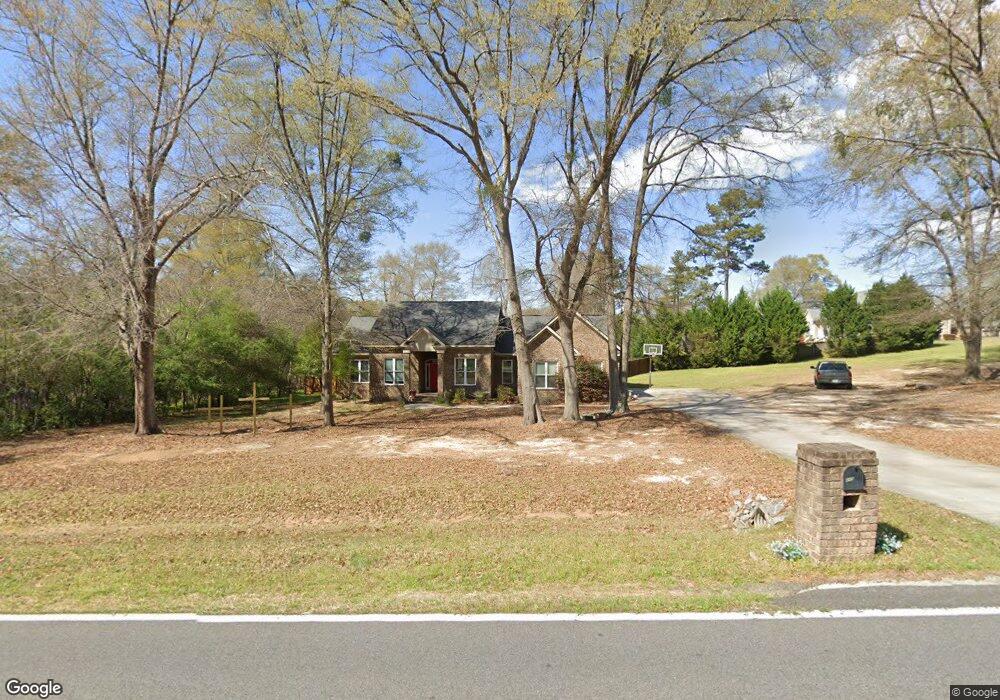
This home is located at 446 Burnett Rd, Byron, GA 31008 and is currently estimated at $397,961, approximately $141 per square foot. 446 Burnett Rd is a home located in Peach County with nearby schools including Byron Elementary School, Byron Middle School, and Peach County High School.
Ownership History
Date
Name
Owned For
Owner Type
Purchase Details
Closed on
Mar 31, 2021
Sold by
Land Bryan A
Bought by
Land Bryan A and Land Sara
Current Estimated Value
Home Financials for this Owner
Home Financials are based on the most recent Mortgage that was taken out on this home.
Original Mortgage
$201,500
Outstanding Balance
$163,950
Interest Rate
3%
Mortgage Type
New Conventional
Estimated Equity
$234,011
Purchase Details
Closed on
Nov 30, 2016
Sold by
James A
Bought by
Land Bryan A
Home Financials for this Owner
Home Financials are based on the most recent Mortgage that was taken out on this home.
Original Mortgage
$215,201
Interest Rate
3.54%
Mortgage Type
New Conventional
Purchase Details
Closed on
Mar 31, 2011
Sold by
Kelly & Sons Construction Llc
Bought by
Land James A
Home Financials for this Owner
Home Financials are based on the most recent Mortgage that was taken out on this home.
Original Mortgage
$209,407
Interest Rate
4.83%
Mortgage Type
VA
Purchase Details
Closed on
Mar 16, 2007
Sold by
Century Land Development Inc
Bought by
Kelly & Sons Construction Llc
Create a Home Valuation Report for This Property
The Home Valuation Report is an in-depth analysis detailing your home's value as well as a comparison with similar homes in the area
Home Values in the Area
Average Home Value in this Area
Purchase History
| Date | Buyer | Sale Price | Title Company |
|---|---|---|---|
| Land Bryan A | -- | -- | |
| Land Bryan A | $235,000 | -- | |
| Land James A | $205,000 | -- | |
| Kelly & Sons Construction Llc | -- | -- |
Source: Public Records
Mortgage History
| Date | Status | Borrower | Loan Amount |
|---|---|---|---|
| Open | Land Bryan A | $201,500 | |
| Previous Owner | Land Bryan A | $215,201 | |
| Previous Owner | Land James A | $209,407 |
Source: Public Records
Tax History
| Year | Tax Paid | Tax Assessment Tax Assessment Total Assessment is a certain percentage of the fair market value that is determined by local assessors to be the total taxable value of land and additions on the property. | Land | Improvement |
|---|---|---|---|---|
| 2025 | $3,880 | $160,240 | $13,480 | $146,760 |
| 2024 | $3,994 | $144,040 | $13,280 | $130,760 |
| 2023 | $3,968 | $141,840 | $10,640 | $131,200 |
| 2022 | $3,329 | $125,680 | $10,640 | $115,040 |
| 2021 | $3,367 | $107,840 | $10,640 | $97,200 |
| 2020 | $3,344 | $100,560 | $10,640 | $89,920 |
| 2019 | $2,999 | $89,080 | $11,480 | $77,600 |
| 2018 | $3,013 | $89,080 | $11,480 | $77,600 |
| 2017 | $3,027 | $89,080 | $11,480 | $77,600 |
| 2016 | $2,952 | $89,080 | $11,480 | $77,600 |
| 2015 | $2,956 | $89,080 | $11,480 | $77,600 |
| 2014 | $2,961 | $89,080 | $11,480 | $77,600 |
| 2013 | -- | $93,160 | $15,560 | $77,600 |
Source: Public Records
Map
Nearby Homes
- 68 Will Way
- 242 Shantz Way
- 244 Shantz Way Unit (LOT A39)
- 242 Shantz Way Unit LOT A38
- 251 Peregrine Dr
- 35 Falcon Crest Way
- 0 Highway 42 Unit 10576098
- 420 Southland Trail
- V L Hwy 42 Unit LotWP001
- 103 June Crest Ct
- 0 Rum Rd Unit 10673128
- 510 Southland Trail
- 538 Southland Trail
- 0 Moseley Rd Unit 261304
- 0 Moseley Rd Unit 183348
- 0 Moseley Rd Unit 10700962
- 101 Poppy Ln
- 00 Rum Rd
- 107 Pine Hill Cir
- 251 Hampton Oaks Way
Your Personal Tour Guide
Ask me questions while you tour the home.