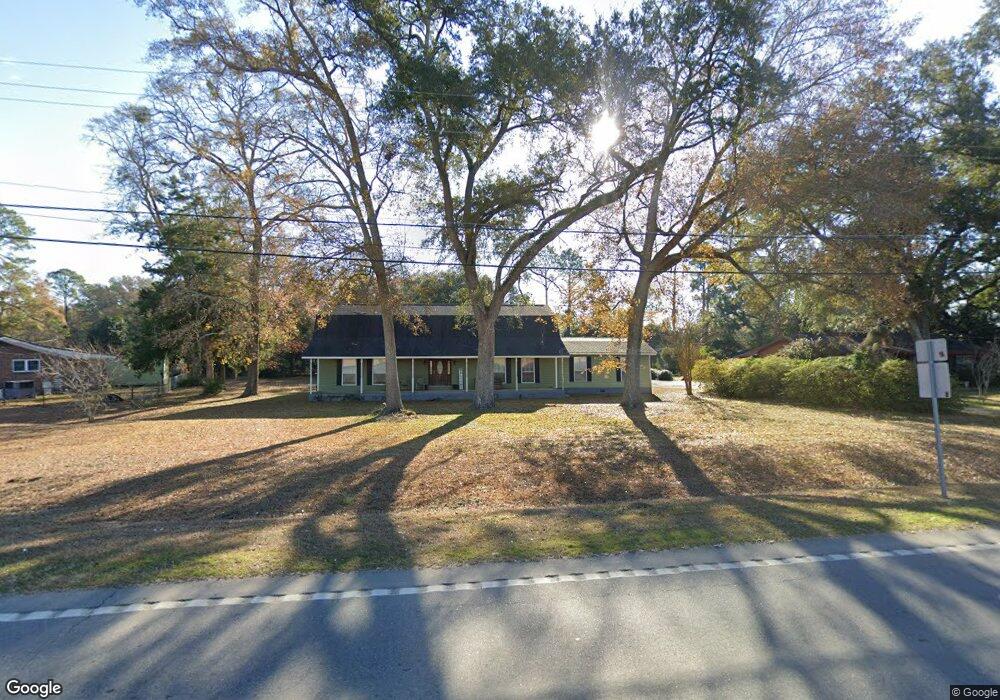
446 Cairo Rd Camilla, GA 31730
Estimated Value: $219,000 - $326,000
Studio
1
Bath
3,760
Sq Ft
$69/Sq Ft
Est. Value
About This Home
This home is located at 446 Cairo Rd, Camilla, GA 31730 and is currently estimated at $260,503, approximately $69 per square foot. 446 Cairo Rd is a home located in Mitchell County with nearby schools including Mitchell County Primary School, Mitchell County Elementary School, and Mitchell County Middle School.
Ownership History
Date
Name
Owned For
Owner Type
Purchase Details
Closed on
May 12, 2021
Sold by
Mccarty Jody M
Bought by
Brinson Brandy A
Current Estimated Value
Home Financials for this Owner
Home Financials are based on the most recent Mortgage that was taken out on this home.
Original Mortgage
$115,772
Outstanding Balance
$103,618
Interest Rate
3%
Mortgage Type
New Conventional
Estimated Equity
$156,885
Purchase Details
Closed on
May 28, 2010
Sold by
Mccarty Jody M
Bought by
Mccarty Jody M and Mccarty Susanne K
Create a Home Valuation Report for This Property
The Home Valuation Report is an in-depth analysis detailing your home's value as well as a comparison with similar homes in the area
Home Values in the Area
Average Home Value in this Area
Purchase History
| Date | Buyer | Sale Price | Title Company |
|---|---|---|---|
| Brinson Brandy A | $112,565 | -- | |
| Mccarty Jody M | -- | -- |
Source: Public Records
Mortgage History
| Date | Status | Borrower | Loan Amount |
|---|---|---|---|
| Open | Brinson Brandy A | $115,772 |
Source: Public Records
Tax History
| Year | Tax Paid | Tax Assessment Tax Assessment Total Assessment is a certain percentage of the fair market value that is determined by local assessors to be the total taxable value of land and additions on the property. | Land | Improvement |
|---|---|---|---|---|
| 2025 | $3,643 | $94,584 | $3,000 | $91,584 |
| 2024 | $3,648 | $94,584 | $3,000 | $91,584 |
| 2023 | $3,944 | $94,584 | $3,000 | $91,584 |
| 2022 | $3,440 | $81,840 | $3,000 | $78,840 |
| 2021 | $3,107 | $75,560 | $3,000 | $72,560 |
| 2020 | $3,107 | $75,560 | $3,000 | $72,560 |
| 2019 | $3,094 | $75,560 | $3,000 | $72,560 |
| 2018 | $3,270 | $74,960 | $2,400 | $72,560 |
| 2017 | $3,208 | $75,901 | $2,400 | $73,501 |
| 2016 | $3,168 | $75,901 | $2,400 | $73,501 |
| 2015 | $3,168 | $75,901 | $2,400 | $73,501 |
| 2014 | $3,168 | $75,901 | $2,400 | $73,501 |
| 2013 | $3,168 | $75,900 | $2,400 | $73,500 |
Source: Public Records
Map
Nearby Homes
- 362 W Camellia Dr
- 291 S Boulevard St
- 199 McDonald St
- 290 Mcree Dr
- 325 Watt St
- 122 Heath St
- 361 Laurel Ln
- 70 S Butler St
- 423 Laurel Ln
- 211 Thomas St
- 164 Davis St
- 0 Butler St
- 180 Lincoln Place
- 15 E Church St
- 107 Morningside Dr
- 7 S Macarthur Dr
- 175 N Harney St
- Tbd Goodson Rd
- 208 E Church St
- 75 Newton St
Your Personal Tour Guide
Ask me questions while you tour the home.