Estimated Value: $536,000 - $672,000
6
Beds
4
Baths
3,606
Sq Ft
$166/Sq Ft
Est. Value
About This Home
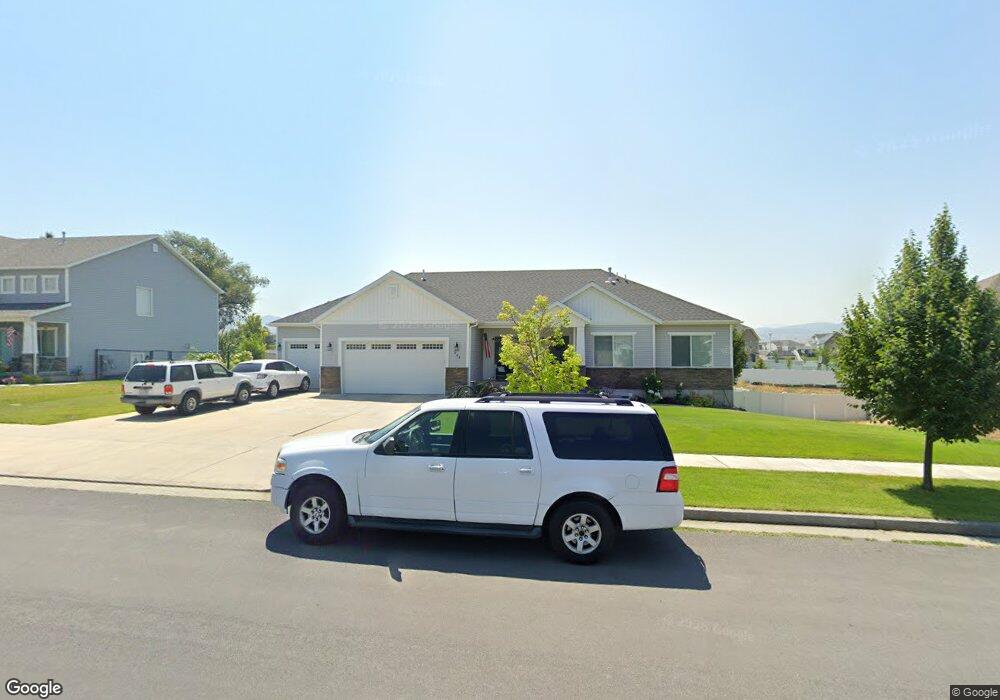
This home is located at 446 E 400 S, Hyrum, UT 84319 and is currently estimated at $597,226, approximately $165 per square foot. 446 E 400 S is a home located in Cache County with nearby schools including Millville School, South Cache Middle School, and Mountain Crest High School.
Ownership History
Date
Name
Owned For
Owner Type
Purchase Details
Closed on
Jul 12, 2018
Sold by
Spillman Micah J and Spillman Catherine P
Bought by
Stabile John A and Stabile Shelley E
Current Estimated Value
Home Financials for this Owner
Home Financials are based on the most recent Mortgage that was taken out on this home.
Original Mortgage
$178,000
Outstanding Balance
$153,940
Interest Rate
4.5%
Mortgage Type
New Conventional
Estimated Equity
$443,286
Purchase Details
Closed on
Mar 18, 2016
Sold by
Kartchner Inc
Bought by
Spillman Micah J and Spillman Catherine P
Purchase Details
Closed on
Jun 15, 2015
Sold by
Rg Development Llc
Bought by
Kartchner Inc
Home Financials for this Owner
Home Financials are based on the most recent Mortgage that was taken out on this home.
Original Mortgage
$250,000
Interest Rate
3.77%
Mortgage Type
Construction
Create a Home Valuation Report for This Property
The Home Valuation Report is an in-depth analysis detailing your home's value as well as a comparison with similar homes in the area
Home Values in the Area
Average Home Value in this Area
Purchase History
| Date | Buyer | Sale Price | Title Company |
|---|---|---|---|
| Stabile John A | -- | Cache Title Logan | |
| Spillman Micah J | -- | Cache Title Logan | |
| Kartchner Inc | -- | Cache Title Logan |
Source: Public Records
Mortgage History
| Date | Status | Borrower | Loan Amount |
|---|---|---|---|
| Open | Stabile John A | $178,000 | |
| Previous Owner | Kartchner Inc | $250,000 |
Source: Public Records
Tax History
| Year | Tax Paid | Tax Assessment Tax Assessment Total Assessment is a certain percentage of the fair market value that is determined by local assessors to be the total taxable value of land and additions on the property. | Land | Improvement |
|---|---|---|---|---|
| 2025 | $2,107 | $302,490 | $0 | $0 |
| 2024 | $2,260 | $303,075 | $0 | $0 |
| 2023 | $2,486 | $318,725 | $0 | $0 |
| 2022 | $2,594 | $318,725 | $0 | $0 |
| 2021 | $2,316 | $438,483 | $75,500 | $362,983 |
| 2020 | $2,202 | $391,138 | $75,500 | $315,638 |
| 2019 | $2,219 | $370,638 | $55,000 | $315,638 |
| 2018 | $2,085 | $336,820 | $55,000 | $281,820 |
| 2017 | $2,122 | $177,870 | $0 | $0 |
| 2016 | $2,170 | $177,760 | $0 | $0 |
| 2015 | $673 | $55,000 | $0 | $0 |
Source: Public Records
Map
Nearby Homes
Your Personal Tour Guide
Ask me questions while you tour the home.