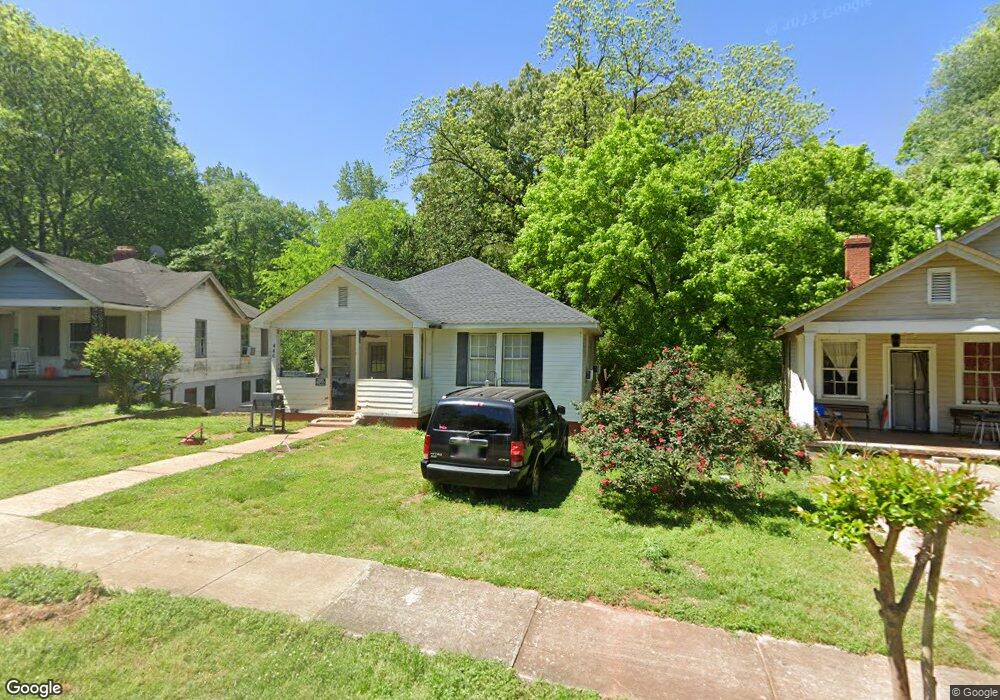
446 E St Thomaston, GA 30286
Estimated Value: $85,571 - $120,000
2
Beds
1
Bath
1,024
Sq Ft
$101/Sq Ft
Est. Value
About This Home
This home is located at 446 E St, Thomaston, GA 30286 and is currently estimated at $103,393, approximately $100 per square foot. 446 E St is a home located in Upson County with nearby schools including Upson-Lee South Elementary School, Upson-Lee North Elementary School, and Upson-Lee Middle School.
Ownership History
Date
Name
Owned For
Owner Type
Purchase Details
Closed on
Mar 27, 2021
Sold by
Johnson Edward Elton
Bought by
Meeler Christy Nicole
Current Estimated Value
Purchase Details
Closed on
May 17, 2019
Sold by
Mobley Leonard Wayne
Bought by
Johnson Edward E
Purchase Details
Closed on
Jan 21, 2011
Sold by
Johnson Edward E
Bought by
Reeves Shirley Brown
Purchase Details
Closed on
Jan 20, 2011
Sold by
Johnson Edward E
Bought by
Reeves Shirley Brown
Purchase Details
Closed on
Aug 25, 2008
Sold by
Franklin Jack T
Bought by
Johnson Edward E and Mobley Leonard Wayne
Create a Home Valuation Report for This Property
The Home Valuation Report is an in-depth analysis detailing your home's value as well as a comparison with similar homes in the area
Purchase History
| Date | Buyer | Sale Price | Title Company |
|---|---|---|---|
| Meeler Christy Nicole | -- | -- | |
| Johnson Edward E | $1,200 | -- | |
| Johnson Edward E | -- | -- | |
| Reeves Shirley Brown | -- | -- | |
| Reeves Shirley Brown | -- | -- | |
| Johnson Edward E | $20,000 | -- |
Source: Public Records
Tax History
| Year | Tax Paid | Tax Assessment Tax Assessment Total Assessment is a certain percentage of the fair market value that is determined by local assessors to be the total taxable value of land and additions on the property. | Land | Improvement |
|---|---|---|---|---|
| 2025 | $821 | $28,118 | $3,200 | $24,918 |
| 2024 | $821 | $22,001 | $3,200 | $18,801 |
| 2023 | $587 | $22,404 | $3,200 | $19,204 |
| 2022 | $504 | $18,122 | $3,200 | $14,922 |
| 2021 | $479 | $16,789 | $3,200 | $13,589 |
| 2020 | $375 | $12,314 | $3,200 | $9,114 |
| 2019 | $414 | $13,050 | $4,800 | $8,250 |
| 2018 | $415 | $13,050 | $4,800 | $8,250 |
| 2017 | $302 | $8,639 | $1,600 | $7,039 |
| 2016 | $418 | $11,765 | $1,600 | $10,165 |
| 2015 | $450 | $12,747 | $1,600 | $11,147 |
| 2014 | $451 | $12,747 | $1,600 | $11,147 |
Source: Public Records
Map
Nearby Homes
- 458 E St
- 0 12th Ave Unit 10630351
- 100 Beaver Run Trace
- 119 F St
- 74 E St
- 114 C St NE
- 106 C St NE
- 228 R St NW
- 719 9th Ave
- 0 9th Ave Unit 10500756
- 115 Hillside Dr
- 146 O St NW
- 201 4th Ave SE
- 516 W Goodrich Ave
- 119 S St NW
- 107 Maynard St
- 354 S Main St
- 0 Goodrich Ave N Unit 10690948
- 600 4th Ave SW
- 0 Glenwood Dr Unit 10568562
Your Personal Tour Guide
Ask me questions while you tour the home.