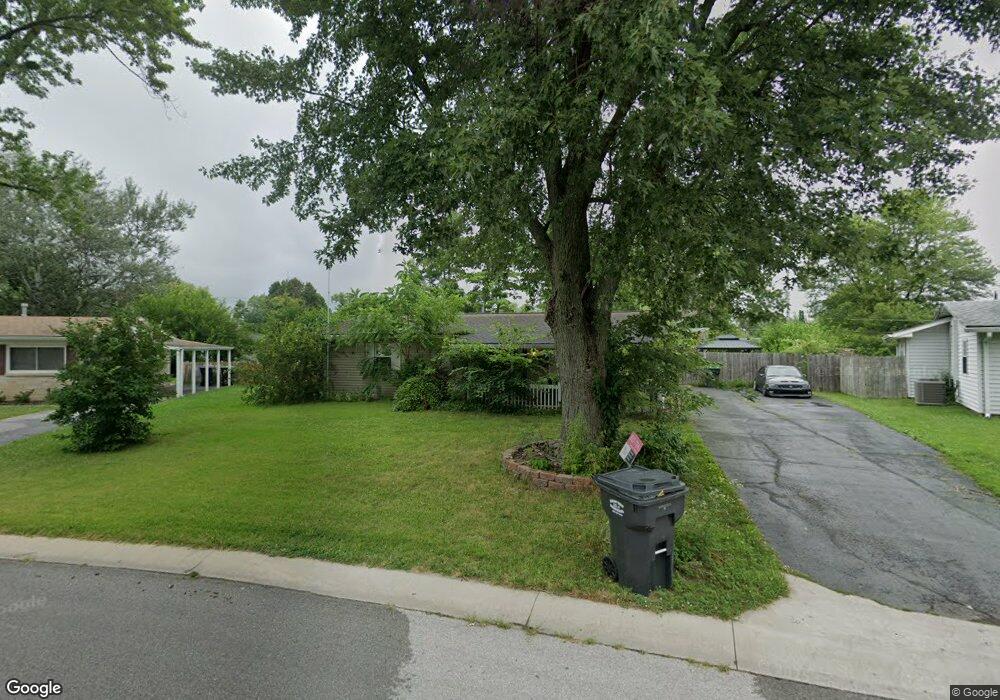
446 Granada Place Whiteland, IN 46184
Estimated Value: $203,000 - $247,000
3
Beds
2
Baths
1,148
Sq Ft
$200/Sq Ft
Est. Value
About This Home
This home is located at 446 Granada Place, Whiteland, IN 46184 and is currently estimated at $229,221, approximately $199 per square foot. 446 Granada Place is a home located in Johnson County with nearby schools including Break-O-Day Elementary School, Clark-Pleasant Middle School, and Whiteland Community High School.
Ownership History
Date
Name
Owned For
Owner Type
Purchase Details
Closed on
Jul 12, 2021
Sold by
Moore Frederick C and Moore Ginger M
Bought by
Shoemaker Riley and Hughes Elizabethkatie Renea
Current Estimated Value
Home Financials for this Owner
Home Financials are based on the most recent Mortgage that was taken out on this home.
Original Mortgage
$187,210
Outstanding Balance
$169,864
Interest Rate
2.9%
Mortgage Type
New Conventional
Estimated Equity
$59,357
Purchase Details
Closed on
Mar 14, 2021
Sold by
Moore Frederick C and Moore Ginger M
Bought by
Moore Trust
Purchase Details
Closed on
Oct 9, 2008
Sold by
Harris Billy
Bought by
Schott Marsha and Schott Michael F
Home Financials for this Owner
Home Financials are based on the most recent Mortgage that was taken out on this home.
Original Mortgage
$26,487
Interest Rate
5.94%
Mortgage Type
New Conventional
Purchase Details
Closed on
May 14, 2007
Sold by
Nies Joyce A
Bought by
Harris Billy
Create a Home Valuation Report for This Property
The Home Valuation Report is an in-depth analysis detailing your home's value as well as a comparison with similar homes in the area
Home Values in the Area
Average Home Value in this Area
Purchase History
| Date | Buyer | Sale Price | Title Company |
|---|---|---|---|
| Shoemaker Riley | $193,000 | None Available | |
| Shoemaker Riley | $193,000 | None Available | |
| Moore Trust | -- | None Available | |
| Schott Marsha | -- | Midwest Title Corporation | |
| Harris Billy | -- | None Available |
Source: Public Records
Mortgage History
| Date | Status | Borrower | Loan Amount |
|---|---|---|---|
| Open | Shoemaker Riley | $187,210 | |
| Previous Owner | Schott Marsha | $26,487 |
Source: Public Records
Tax History Compared to Growth
Tax History
| Year | Tax Paid | Tax Assessment Tax Assessment Total Assessment is a certain percentage of the fair market value that is determined by local assessors to be the total taxable value of land and additions on the property. | Land | Improvement |
|---|---|---|---|---|
| 2025 | $1,996 | $205,600 | $42,000 | $163,600 |
| 2024 | $1,996 | $197,800 | $42,000 | $155,800 |
| 2023 | $1,987 | $190,700 | $42,000 | $148,700 |
| 2022 | $1,852 | $179,200 | $35,000 | $144,200 |
| 2021 | $1,034 | $110,400 | $35,000 | $75,400 |
| 2020 | $811 | $89,600 | $31,600 | $58,000 |
| 2019 | $666 | $81,000 | $24,000 | $57,000 |
| 2018 | $663 | $80,200 | $20,300 | $59,900 |
| 2017 | $654 | $79,400 | $20,300 | $59,100 |
| 2016 | $1,419 | $72,800 | $20,300 | $52,500 |
| 2014 | $1,263 | $62,900 | $16,300 | $46,600 |
| 2013 | $1,263 | $64,000 | $16,300 | $47,700 |
Source: Public Records
Map
Nearby Homes
- 624 Sweetbriar Ave
- 539 Delbrook Dr
- 840 Sweetbriar Ave
- 0 E 700 N Unit MBR22036500
- 269 Switchgrass Ln
- 287 Bluestem Ln
- 144 Bluestem Ln
- 250 Southlane Dr
- 111 Meadow Creek Blvd
- 50 Meadow Creek Blvd
- 239 Shelton Place
- 257 Creekway Ct
- 230 Parkview Dr
- 821 Princeton Dr
- 249 Lori Ann Dr
- 229 Arlington St
- 241 Mooreland Dr
- 42 Grassyway Ct
- 143 Tracy Ridge Blvd
- 409 Parkway St
- 452 Granada Place
- 440 Granada Place
- 451 Pleasant Dr
- 702 Sweetbriar Ave
- 644 Sweetbriar Ave
- 443 Pleasant Dr
- 710 Sweetbriar Ave
- 434 Granada Place
- 460 Granada Place
- 638 Sweetbriar Ave
- 445 Granada Place
- 435 Pleasant Dr
- 630 Sweetbriar Ave
- 431 Granada Place
- 429 Pleasant Dr
- 426 Granada Place
- 504 Hollybrook Dr
- 440 Hollybrook Dr
- 446 Pleasant Dr
- 722 Sweetbriar Ave