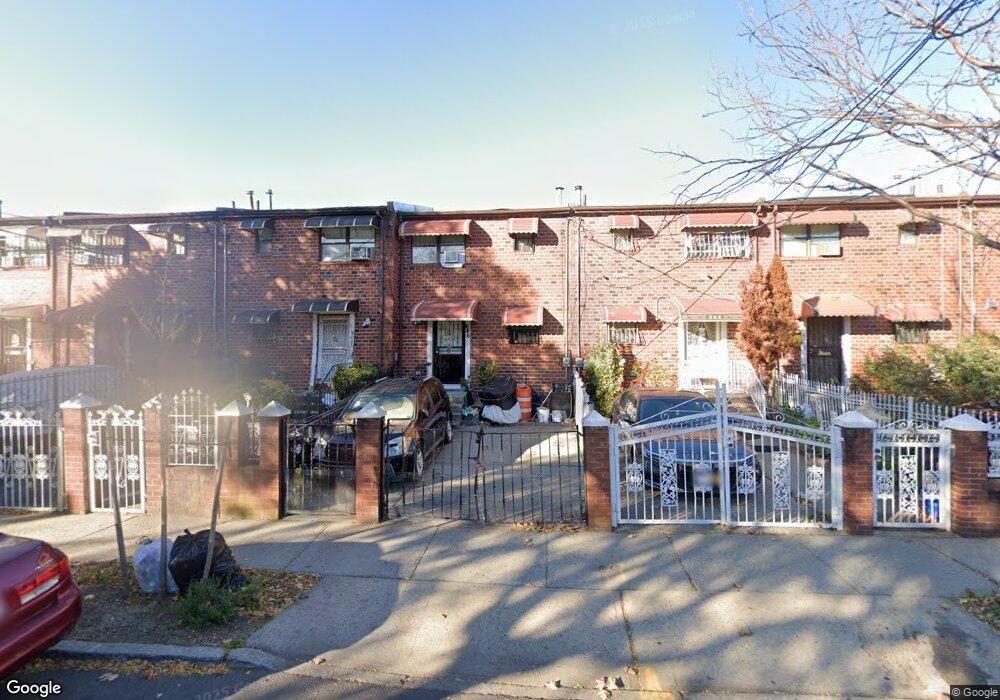
446 Hendrix St Brooklyn, NY 11207
East New York NeighborhoodEstimated Value: $555,293 - $656,000
Studio
--
Bath
1,132
Sq Ft
$534/Sq Ft
Est. Value
About This Home
This home is located at 446 Hendrix St, Brooklyn, NY 11207 and is currently estimated at $604,573, approximately $534 per square foot. 446 Hendrix St is a home located in Kings County with nearby schools including P.S. 158 Warwick, J.H.S 292 Margaret S. Douglas, and Salve Regina Catholic Academy.
Ownership History
Date
Name
Owned For
Owner Type
Purchase Details
Closed on
Dec 29, 2018
Sold by
Moore Howard P and Ward Leonie R
Bought by
Ward Leonie R
Current Estimated Value
Purchase Details
Closed on
Jan 18, 2010
Sold by
Moore Henry S and Moore Ica O
Bought by
Moore Howard P and Ward Leonie R
Purchase Details
Closed on
Dec 13, 1990
Sold by
East Bk Church Sponcomm
Bought by
Browne Doris Hall
Home Financials for this Owner
Home Financials are based on the most recent Mortgage that was taken out on this home.
Original Mortgage
$46,400
Interest Rate
10.02%
Mortgage Type
Purchase Money Mortgage
Purchase Details
Closed on
Nov 20, 1990
Sold by
East Bklyn Chur Sponcom
Bought by
Francis Esrine and Francis Morris
Home Financials for this Owner
Home Financials are based on the most recent Mortgage that was taken out on this home.
Original Mortgage
$46,400
Interest Rate
10.02%
Mortgage Type
Purchase Money Mortgage
Create a Home Valuation Report for This Property
The Home Valuation Report is an in-depth analysis detailing your home's value as well as a comparison with similar homes in the area
Home Values in the Area
Average Home Value in this Area
Purchase History
| Date | Buyer | Sale Price | Title Company |
|---|---|---|---|
| Ward Leonie R | -- | -- | |
| Moore Howard P | -- | -- | |
| Browne Doris Hall | -- | -- | |
| Francis Esrine | -- | -- | |
| Moore Henry | -- | -- | |
| Dawson Esther | -- | -- |
Source: Public Records
Mortgage History
| Date | Status | Borrower | Loan Amount |
|---|---|---|---|
| Previous Owner | Browne Doris Hall | $46,400 | |
| Previous Owner | Dawson Esther | $42,000 |
Source: Public Records
Tax History
| Year | Tax Paid | Tax Assessment Tax Assessment Total Assessment is a certain percentage of the fair market value that is determined by local assessors to be the total taxable value of land and additions on the property. | Land | Improvement |
|---|---|---|---|---|
| 2025 | $3,488 | $33,540 | $9,000 | $24,540 |
| 2024 | $3,488 | $27,720 | $9,000 | $18,720 |
| 2023 | $3,328 | $31,680 | $9,000 | $22,680 |
| 2022 | $3,271 | $28,740 | $9,000 | $19,740 |
| 2021 | $3,363 | $24,900 | $9,000 | $15,900 |
| 2020 | $1,605 | $23,640 | $9,000 | $14,640 |
| 2019 | $3,028 | $25,740 | $9,000 | $16,740 |
| 2018 | $2,783 | $13,654 | $6,380 | $7,274 |
| 2017 | $2,783 | $13,654 | $5,721 | $7,933 |
| 2016 | $2,662 | $13,317 | $5,284 | $8,033 |
| 2015 | $1,554 | $12,783 | $6,370 | $6,413 |
| 2014 | $1,554 | $12,061 | $6,285 | $5,776 |
Source: Public Records
Map
Nearby Homes
- 444 Hendrix St
- 448 Hendrix St
- 442 Hendrix St
- 450 Hendrix St
- 440 Hendrix St
- 452 Hendrix St
- 438 Hendrix St
- 454 Hendrix St
- 456 Hendrix St
- 436 Hendrix St
- 367 van Siclen Ave
- 458 Hendrix St
- 371 van Siclen Ave
- 432 Hendrix St
- 460 Hendrix St
- 381 van Siclen Ave
- 361 van Siclen Ave
- 359 van Siclen Ave
- 383 van Siclen Ave
- 375 van Siclen Ave
Your Personal Tour Guide
Ask me questions while you tour the home.