Estimated Value: $780,580 - $925,000
3
Beds
2
Baths
2,452
Sq Ft
$357/Sq Ft
Est. Value
About This Home
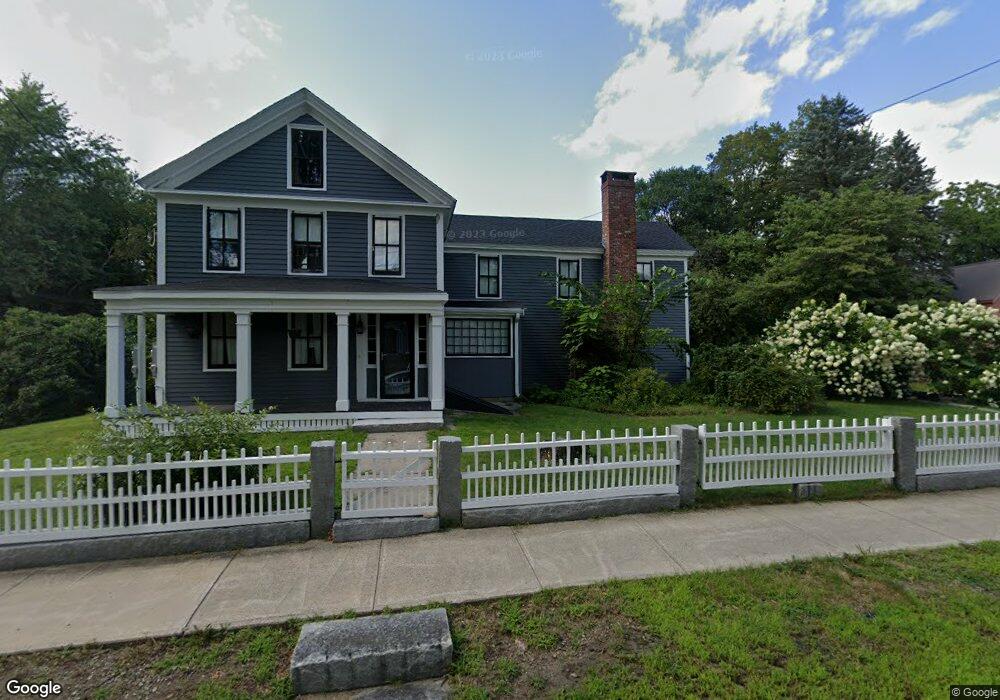
This home is located at 446 Main St, Acton, MA 01720 and is currently estimated at $874,145, approximately $356 per square foot. 446 Main St is a home located in Middlesex County with nearby schools including Acton-Boxborough Regional High School and Oak Meadow Montessori School.
Ownership History
Date
Name
Owned For
Owner Type
Purchase Details
Closed on
Jun 30, 2008
Sold by
Birch Nathan A
Bought by
Mcbride Owen and Mcbride Sarah
Current Estimated Value
Home Financials for this Owner
Home Financials are based on the most recent Mortgage that was taken out on this home.
Original Mortgage
$363,850
Outstanding Balance
$234,730
Interest Rate
6.07%
Mortgage Type
Purchase Money Mortgage
Estimated Equity
$639,415
Purchase Details
Closed on
Oct 27, 2004
Sold by
Est Birch Barbara A and Birch Nathan A
Bought by
Birch Nathan A
Home Financials for this Owner
Home Financials are based on the most recent Mortgage that was taken out on this home.
Original Mortgage
$110,000
Interest Rate
5.74%
Mortgage Type
Purchase Money Mortgage
Create a Home Valuation Report for This Property
The Home Valuation Report is an in-depth analysis detailing your home's value as well as a comparison with similar homes in the area
Home Values in the Area
Average Home Value in this Area
Purchase History
| Date | Buyer | Sale Price | Title Company |
|---|---|---|---|
| Mcbride Owen | $383,000 | -- | |
| Birch Nathan A | -- | -- |
Source: Public Records
Mortgage History
| Date | Status | Borrower | Loan Amount |
|---|---|---|---|
| Open | Mcbride Owen | $363,850 | |
| Previous Owner | Birch Nathan A | $110,000 |
Source: Public Records
Tax History
| Year | Tax Paid | Tax Assessment Tax Assessment Total Assessment is a certain percentage of the fair market value that is determined by local assessors to be the total taxable value of land and additions on the property. | Land | Improvement |
|---|---|---|---|---|
| 2025 | $10,021 | $584,300 | $317,900 | $266,400 |
| 2024 | $9,740 | $584,300 | $317,900 | $266,400 |
| 2023 | $9,579 | $545,500 | $288,900 | $256,600 |
| 2022 | $9,223 | $474,200 | $251,100 | $223,100 |
| 2021 | $8,905 | $440,200 | $232,500 | $207,700 |
| 2020 | $8,550 | $444,400 | $232,500 | $211,900 |
| 2019 | $8,172 | $421,900 | $232,500 | $189,400 |
| 2018 | $8,095 | $417,700 | $232,500 | $185,200 |
| 2017 | $7,826 | $410,600 | $232,500 | $178,100 |
| 2016 | $7,842 | $407,800 | $232,500 | $175,300 |
| 2015 | $7,715 | $405,000 | $232,500 | $172,500 |
| 2014 | $7,603 | $390,900 | $232,500 | $158,400 |
Source: Public Records
Map
Nearby Homes
Your Personal Tour Guide
Ask me questions while you tour the home.