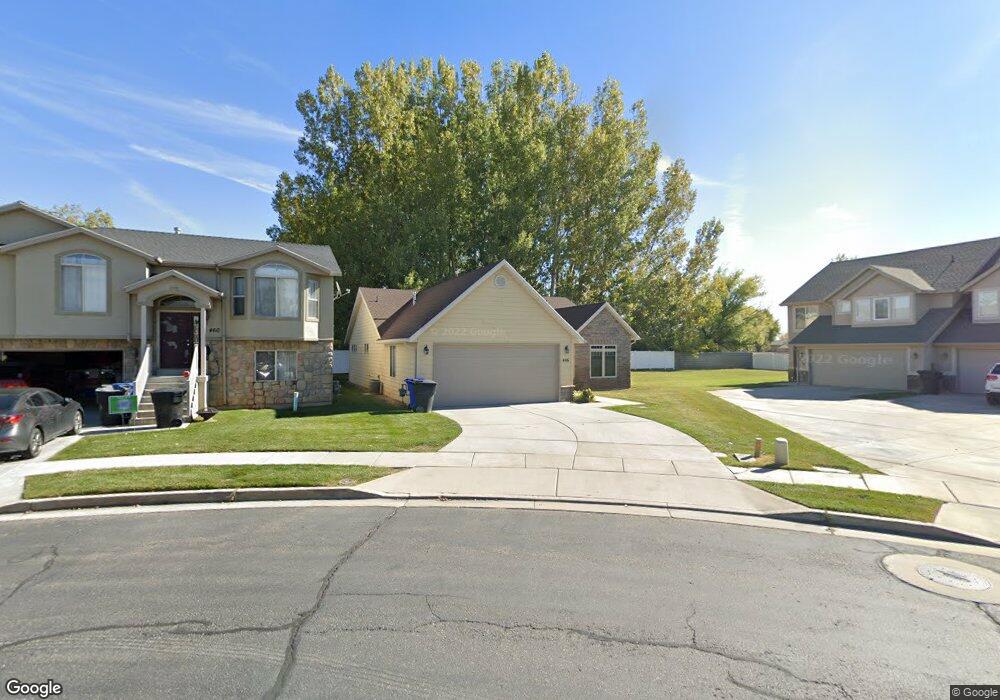
446 N 3100 W Clearfield, UT 84015
Estimated Value: $419,750 - $451,000
2
Beds
2
Baths
1,385
Sq Ft
$317/Sq Ft
Est. Value
About This Home
This home is located at 446 N 3100 W, Clearfield, UT 84015 and is currently estimated at $438,438, approximately $316 per square foot. 446 N 3100 W is a home located in Davis County with nearby schools including West Point School, West Point Junior High School, and Syracuse High School.
Ownership History
Date
Name
Owned For
Owner Type
Purchase Details
Closed on
Mar 19, 2004
Sold by
Smith Brubaker Haacke Lc
Bought by
Hamblin George C and Hamblin Marian
Current Estimated Value
Purchase Details
Closed on
Mar 11, 2004
Sold by
Miles Edward O
Bought by
Smith Brubaker Haacke Lc
Purchase Details
Closed on
Sep 10, 2003
Sold by
Cape Construction Co Inc
Bought by
Miles Edward O
Purchase Details
Closed on
Apr 17, 2002
Sold by
West Point Prud Llc
Bought by
Cape Construction Company Inc
Create a Home Valuation Report for This Property
The Home Valuation Report is an in-depth analysis detailing your home's value as well as a comparison with similar homes in the area
Home Values in the Area
Average Home Value in this Area
Purchase History
| Date | Buyer | Sale Price | Title Company |
|---|---|---|---|
| Hamblin George C | -- | Equity Title Agency | |
| Smith Brubaker Haacke Lc | -- | Patriot Title Co | |
| Miles Edward O | -- | Security Title Company | |
| Cape Construction Company Inc | -- | Security Title Company |
Source: Public Records
Tax History Compared to Growth
Tax History
| Year | Tax Paid | Tax Assessment Tax Assessment Total Assessment is a certain percentage of the fair market value that is determined by local assessors to be the total taxable value of land and additions on the property. | Land | Improvement |
|---|---|---|---|---|
| 2025 | $2,307 | $216,150 | $72,600 | $143,550 |
| 2024 | $2,215 | $208,450 | $52,250 | $156,200 |
| 2023 | $2,050 | $195,250 | $48,400 | $146,850 |
| 2022 | $2,188 | $377,000 | $84,000 | $293,000 |
| 2021 | $1,961 | $278,000 | $67,000 | $211,000 |
| 2020 | $1,808 | $253,000 | $62,400 | $190,600 |
| 2019 | $1,754 | $242,000 | $60,000 | $182,000 |
| 2018 | $1,566 | $213,000 | $62,000 | $151,000 |
| 2016 | $1,309 | $93,665 | $19,250 | $74,415 |
| 2015 | $1,351 | $91,575 | $19,250 | $72,325 |
| 2014 | $1,280 | $88,002 | $19,250 | $68,752 |
| 2013 | -- | $89,709 | $18,095 | $71,614 |
Source: Public Records
Map
Nearby Homes
- 488 N 3100 W
- 3187 W 525 N
- 3212 W 600 N
- 399 N 3425 W
- 2633 N 2080 W Unit 180
- 2623 N 2080 W Unit 178
- 380 S 4300 W Unit 608
- 997 N 5100 W Unit 213
- 2619 N 2080 W Unit 177
- 2627 N 2080 W Unit 179
- 3232 W 375 N Unit 7
- 3258 W 375 N Unit 9
- 260 W Antelope Dr S
- 4200 W 800 N
- 2535 W 550 N
- 2792 W 50 S
- 2816 W 960 N
- 878 N 2600 W
- 164 S 2875 W
- 1159 S 4350 W