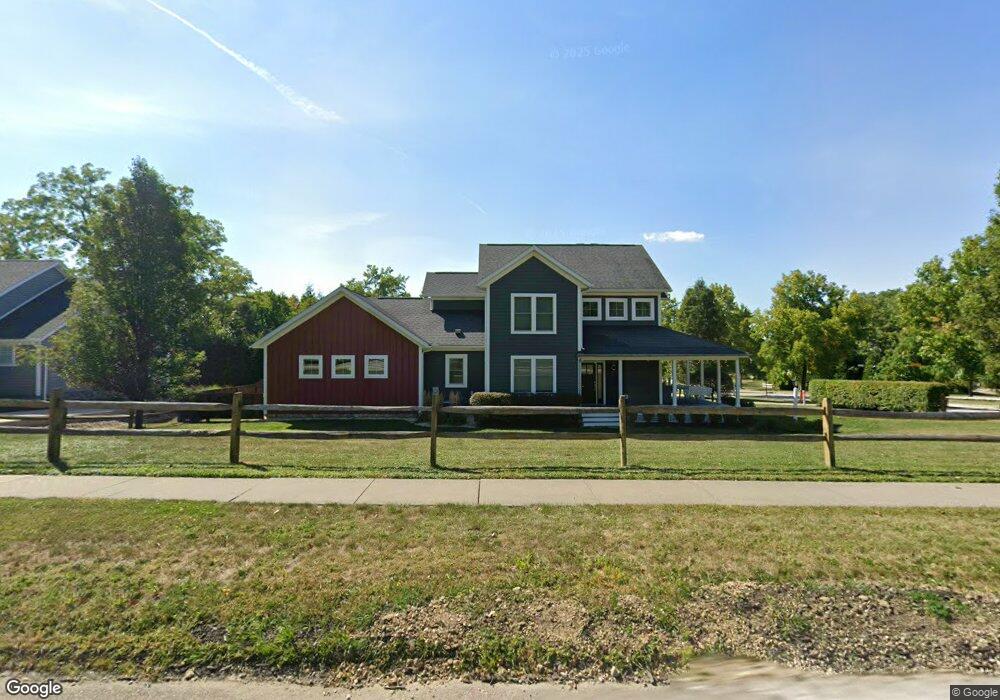
446 N Main St Hudson, OH 44236
Estimated Value: $513,000 - $591,713
3
Beds
3
Baths
2,170
Sq Ft
$254/Sq Ft
Est. Value
About This Home
This home is located at 446 N Main St, Hudson, OH 44236 and is currently estimated at $550,178, approximately $253 per square foot. 446 N Main St is a home with nearby schools including Ellsworth Hill Elementary School, East Woods Intermediate School, and Hudson Middle School.
Ownership History
Date
Name
Owned For
Owner Type
Purchase Details
Closed on
Mar 9, 2020
Sold by
Lopienski Thomas J
Bought by
Lopienski Thomas J and Lopienski Catherine E
Current Estimated Value
Purchase Details
Closed on
Sep 26, 2012
Sold by
Stevenson Jack D and Dixon Denise E
Bought by
Lopienski Thomas J
Purchase Details
Closed on
Mar 20, 2009
Sold by
Stevenson Jack D
Bought by
Dixon Denise E and Stevenson Jack D
Purchase Details
Closed on
Aug 7, 2007
Sold by
Wohlwend Michael J and Wohlwend Jennifer K
Bought by
Stevenson Jack D
Create a Home Valuation Report for This Property
The Home Valuation Report is an in-depth analysis detailing your home's value as well as a comparison with similar homes in the area
Home Values in the Area
Average Home Value in this Area
Purchase History
| Date | Buyer | Sale Price | Title Company |
|---|---|---|---|
| Lopienski Thomas J | -- | None Listed On Document | |
| Lopienski Thomas J | -- | None Listed On Document | |
| Lopienski Thomas J | $92,500 | None Available | |
| Dixon Denise E | -- | None Available | |
| Stevenson Jack D | $184,000 | Wigley Title Agency Inc |
Source: Public Records
Tax History Compared to Growth
Tax History
| Year | Tax Paid | Tax Assessment Tax Assessment Total Assessment is a certain percentage of the fair market value that is determined by local assessors to be the total taxable value of land and additions on the property. | Land | Improvement |
|---|---|---|---|---|
| 2025 | $7,492 | $147,036 | $32,925 | $114,111 |
| 2024 | $7,492 | $147,036 | $32,925 | $114,111 |
| 2023 | $7,492 | $147,036 | $32,925 | $114,111 |
| 2022 | $6,600 | $115,500 | $26,341 | $89,159 |
| 2021 | $6,611 | $115,500 | $26,341 | $89,159 |
| 2020 | $7,803 | $139,040 | $26,340 | $112,700 |
| 2019 | $6,252 | $102,910 | $21,000 | $81,910 |
| 2018 | $6,230 | $102,910 | $21,000 | $81,910 |
| 2017 | $6,171 | $102,910 | $21,000 | $81,910 |
| 2016 | $6,288 | $100,270 | $21,000 | $79,270 |
| 2015 | $6,171 | $100,270 | $21,000 | $79,270 |
| 2014 | $6,969 | $112,920 | $21,000 | $91,920 |
| 2013 | $1,365 | $21,000 | $21,000 | $0 |
Source: Public Records
Map
Nearby Homes
- 157 Hudson St
- 12 Tanager Dr
- 77 Atterbury Blvd Unit 106
- 2221 Kate Ct
- 7511 Herrick Park Dr
- 180 Atterbury Blvd
- 181 Boston Mills Rd
- 48 Prescott Dr
- 1556 W Prospect St
- 311 W Streetsboro St
- 89 Sussex Rd
- 94 Fox Trace Ln
- 1644 Stonington Dr
- 35 S Hayden Pkwy
- 1440 E Hines Hill Rd
- 1453 Prospect Rd
- 2380 Victoria Pkwy
- 7488 Valley View Rd
- 1593 Stonington Dr
- 21 Keswick Dr