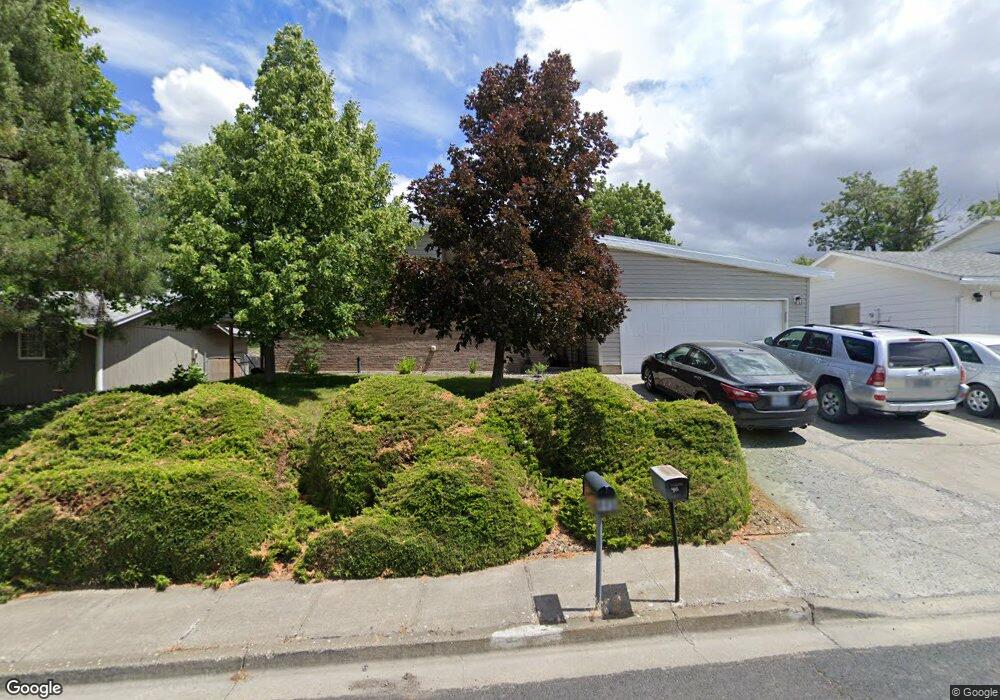
446 NW 21st St Pendleton, OR 97801
Estimated Value: $307,000 - $383,010
4
Beds
2
Baths
2,040
Sq Ft
$174/Sq Ft
Est. Value
About This Home
This home is located at 446 NW 21st St, Pendleton, OR 97801 and is currently estimated at $354,003, approximately $173 per square foot. 446 NW 21st St is a home located in Umatilla County with nearby schools including Sunridge Middle School, Pendleton High School, and Pendleton Christian School.
Ownership History
Date
Name
Owned For
Owner Type
Purchase Details
Closed on
Nov 21, 2012
Sold by
Federal Home Loan Mortgage Corporation
Bought by
Derrickson Michael P and Derrickson Rebecca E
Current Estimated Value
Home Financials for this Owner
Home Financials are based on the most recent Mortgage that was taken out on this home.
Original Mortgage
$141,020
Outstanding Balance
$97,263
Interest Rate
3.35%
Mortgage Type
New Conventional
Estimated Equity
$256,740
Purchase Details
Closed on
Apr 24, 2012
Sold by
Barnes Marilyn L
Bought by
Federal Home Loan Mortgage Corporation
Purchase Details
Closed on
Jun 19, 2007
Sold by
Long Daniel S and Long Christine R
Bought by
Barnes Marilyn L
Home Financials for this Owner
Home Financials are based on the most recent Mortgage that was taken out on this home.
Original Mortgage
$144,000
Interest Rate
6.16%
Mortgage Type
New Conventional
Create a Home Valuation Report for This Property
The Home Valuation Report is an in-depth analysis detailing your home's value as well as a comparison with similar homes in the area
Home Values in the Area
Average Home Value in this Area
Purchase History
| Date | Buyer | Sale Price | Title Company |
|---|---|---|---|
| Derrickson Michael P | $134,900 | Amerititle | |
| Federal Home Loan Mortgage Corporation | $139,487 | Pioneer Title Co | |
| Barnes Marilyn L | $180,000 | Pioneer Title Co |
Source: Public Records
Mortgage History
| Date | Status | Borrower | Loan Amount |
|---|---|---|---|
| Open | Derrickson Michael P | $141,020 | |
| Previous Owner | Barnes Marilyn L | $144,000 |
Source: Public Records
Tax History
| Year | Tax Paid | Tax Assessment Tax Assessment Total Assessment is a certain percentage of the fair market value that is determined by local assessors to be the total taxable value of land and additions on the property. | Land | Improvement |
|---|---|---|---|---|
| 2022 | $3,528 | $195,060 | $0 | $0 |
| 2021 | $3,548 | $189,380 | $55,920 | $133,460 |
| 2020 | $3,427 | $183,870 | $54,290 | $129,580 |
| 2018 | $3,330 | $173,330 | $51,170 | $122,160 |
| 2017 | $3,251 | $168,290 | $49,680 | $118,610 |
| 2016 | $3,070 | $163,390 | $48,230 | $115,160 |
| 2015 | $3,049 | $149,540 | $44,150 | $105,390 |
| 2014 | $2,942 | $149,540 | $44,150 | $105,390 |
Source: Public Records
Map
Nearby Homes
- 2262 NW Horn Place
- 1900 NW Carden Ave
- 510 NW 11th St
- 913 NW Ellis Ave
- 1003 NW Carden Ave
- 735 NW 10th St
- 412 NW 8th St
- 3 NW 9th St
- 712 NW 6th St
- 401 NW Bailey Ave
- 425 SW 17th St
- 615 NW 3rd St
- 415 N Main St
- 514 SW 13th St
- 706 NW 3rd Dr
- 0 N Main St
- 415 SW 7th St
- 732 N Main St
- 524 SW 12th St
- 628 N Main St
Your Personal Tour Guide
Ask me questions while you tour the home.