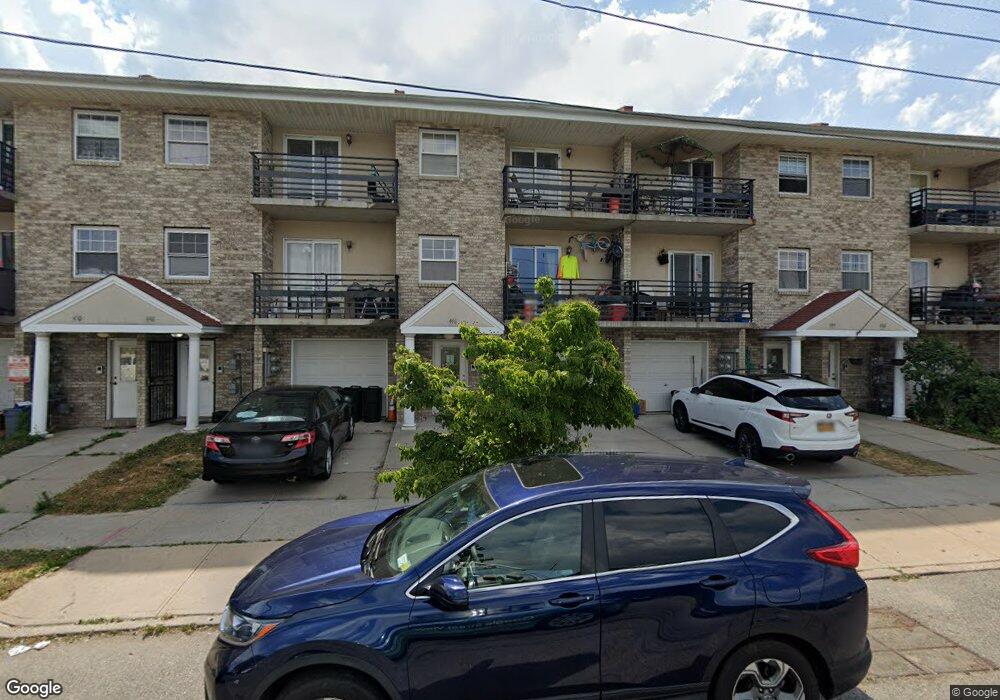
446 Sapphire St Unit 3 Brooklyn, NY 11208
East New York NeighborhoodEstimated Value: $851,000 - $1,154,000
3
Beds
1
Bath
1,000
Sq Ft
$973/Sq Ft
Est. Value
About This Home
This home is located at 446 Sapphire St Unit 3, Brooklyn, NY 11208 and is currently estimated at $973,369, approximately $973 per square foot. 446 Sapphire St Unit 3 is a home located in Kings County with nearby schools including P.S. 224 Hale A Woodruff, Van Siclen Community Middle School, and Our World Neighborhood Charter School 2.
Ownership History
Date
Name
Owned For
Owner Type
Purchase Details
Closed on
Jun 26, 2015
Sold by
Griffon Loring Llc
Bought by
R & Q Macdougal Inc
Current Estimated Value
Home Financials for this Owner
Home Financials are based on the most recent Mortgage that was taken out on this home.
Original Mortgage
$332,500
Outstanding Balance
$259,445
Interest Rate
3.88%
Mortgage Type
New Conventional
Estimated Equity
$713,924
Purchase Details
Closed on
Jul 21, 2009
Sold by
Loring Estates Llc
Bought by
Halifax Group Llc
Purchase Details
Closed on
Jun 27, 2007
Sold by
Luka Agathia
Bought by
Luka Agathia and Luka Ylli
Home Financials for this Owner
Home Financials are based on the most recent Mortgage that was taken out on this home.
Original Mortgage
$612,000
Interest Rate
6.39%
Purchase Details
Closed on
Jun 25, 2007
Sold by
Loring Estates Llc
Bought by
Luka Agathia
Home Financials for this Owner
Home Financials are based on the most recent Mortgage that was taken out on this home.
Original Mortgage
$612,000
Interest Rate
6.39%
Create a Home Valuation Report for This Property
The Home Valuation Report is an in-depth analysis detailing your home's value as well as a comparison with similar homes in the area
Home Values in the Area
Average Home Value in this Area
Purchase History
| Date | Buyer | Sale Price | Title Company |
|---|---|---|---|
| R & Q Macdougal Inc | $600,000 | -- | |
| Halifax Group Llc | $200,000 | -- | |
| Luka Agathia | -- | -- | |
| Luka Agathia | $765,000 | -- |
Source: Public Records
Mortgage History
| Date | Status | Borrower | Loan Amount |
|---|---|---|---|
| Open | R & Q Macdougal Inc | $332,500 | |
| Previous Owner | Luka Agathia | $612,000 |
Source: Public Records
Tax History Compared to Growth
Tax History
| Year | Tax Paid | Tax Assessment Tax Assessment Total Assessment is a certain percentage of the fair market value that is determined by local assessors to be the total taxable value of land and additions on the property. | Land | Improvement |
|---|---|---|---|---|
| 2025 | $7,844 | $53,460 | $8,100 | $45,360 |
| 2024 | $7,844 | $62,880 | $8,100 | $54,780 |
| 2023 | $7,931 | $62,460 | $8,100 | $54,360 |
| 2022 | $7,720 | $57,180 | $8,100 | $49,080 |
| 2021 | $7,677 | $44,160 | $8,100 | $36,060 |
| 2020 | $3,600 | $40,500 | $8,100 | $32,400 |
| 2019 | $6,808 | $40,500 | $8,100 | $32,400 |
| 2018 | $6,634 | $32,544 | $7,384 | $25,160 |
| 2017 | $6,569 | $32,224 | $7,526 | $24,698 |
| 2016 | $6,077 | $30,400 | $7,003 | $23,397 |
| 2015 | $4,268 | $28,680 | $9,000 | $19,680 |
| 2014 | $4,268 | $27,120 | $9,000 | $18,120 |
Source: Public Records
Map
Nearby Homes
- 7802 149th Ave
- 629 Emerald St
- 1385 Stanley Ave
- 7802 151st Ave
- 15115 78th St Unit 2
- 151-26 79th St Unit 3
- 151-37 78th St Unit 2W-1
- 7813 153rd Ave Unit 1F2, 1FG
- 81-5 149th Ave
- 133- 38 Amber St
- 8210 149th Ave
- 153-32 79th St
- 133-24 78th St
- 133-155 77th St
- 151-42 82nd St
- 439 Forbell St
- 155- 3 79th St Unit 188
- 151-15 84 St Unit 6 D
- 151-15 84th St Unit 3E
- 151-15 84th St Unit 1F
- 446 Sapphire St
- 444 Sapphire St
- 448 Sapphire St
- 450 Sapphire St
- 442 Sapphire St
- 438 Sapphire St
- 14930 78th St
- 436 Sapphire St
- 445 Amber St
- 447 Amber St
- 443 Amber St
- 1425 Stanley Ave
- 1427 Stanley Ave
- 449 Amber St
- 441 Amber St
- 1423 Stanley Ave
- 1429 Stanley Ave
- 1421 Stanley Ave
- 439 Amber St
- 434 Sapphire St