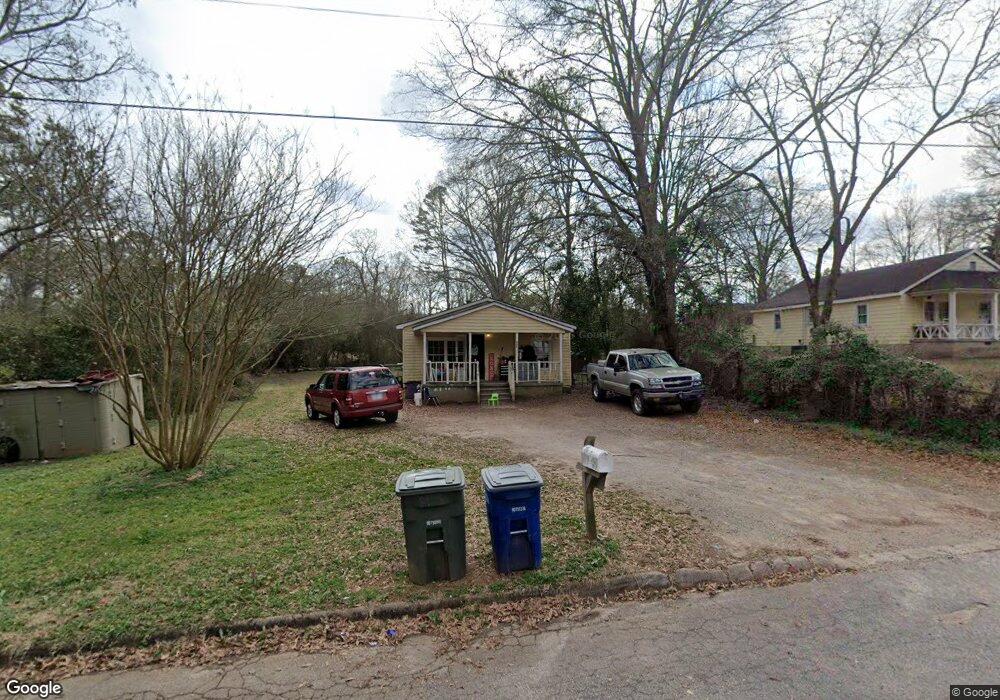
446 Spring St Griffin, GA 30223
Spalding County NeighborhoodEstimated Value: $90,153 - $130,000
2
Beds
1
Bath
840
Sq Ft
$125/Sq Ft
Est. Value
About This Home
This home is located at 446 Spring St, Griffin, GA 30223 and is currently estimated at $104,788, approximately $124 per square foot. 446 Spring St is a home located in Spalding County with nearby schools including Jackson Road Elementary School, Kennedy Road Middle School, and Spalding High School.
Ownership History
Date
Name
Owned For
Owner Type
Purchase Details
Closed on
Mar 14, 2016
Sold by
Bbj Holdings Llc
Bought by
Johnson Anthony O
Current Estimated Value
Purchase Details
Closed on
Oct 1, 2012
Sold by
Hollberg David Alan
Bought by
Bbj Holdings Inc
Purchase Details
Closed on
Nov 4, 1998
Sold by
Hollberg Jr M Douglas
Bought by
Hollberg David A
Home Financials for this Owner
Home Financials are based on the most recent Mortgage that was taken out on this home.
Original Mortgage
$33,600
Interest Rate
6.65%
Mortgage Type
New Conventional
Purchase Details
Closed on
Jun 8, 1992
Sold by
Hollberg Douglas
Bought by
Hollberg M Douglas
Purchase Details
Closed on
Jul 1, 1976
Sold by
Hollberg Douglas
Bought by
Hollberg M Douglas
Purchase Details
Closed on
Feb 17, 1959
Bought by
Hollberg Douglas
Create a Home Valuation Report for This Property
The Home Valuation Report is an in-depth analysis detailing your home's value as well as a comparison with similar homes in the area
Home Values in the Area
Average Home Value in this Area
Purchase History
| Date | Buyer | Sale Price | Title Company |
|---|---|---|---|
| Johnson Anthony O | $15,000 | -- | |
| Bbj Holdings Inc | $22,000 | -- | |
| Hollberg David A | $25,000 | -- | |
| Hollberg M Douglas | -- | -- | |
| Hollberg M Douglas | $562,500 | -- | |
| Hollberg Douglas | -- | -- |
Source: Public Records
Mortgage History
| Date | Status | Borrower | Loan Amount |
|---|---|---|---|
| Previous Owner | Hollberg David A | $33,600 |
Source: Public Records
Tax History Compared to Growth
Tax History
| Year | Tax Paid | Tax Assessment Tax Assessment Total Assessment is a certain percentage of the fair market value that is determined by local assessors to be the total taxable value of land and additions on the property. | Land | Improvement |
|---|---|---|---|---|
| 2024 | $424 | $11,858 | $3,000 | $8,858 |
| 2023 | $424 | $10,778 | $1,920 | $8,858 |
| 2022 | $336 | $9,238 | $1,200 | $8,038 |
| 2021 | $277 | $7,613 | $1,200 | $6,413 |
| 2020 | $239 | $6,544 | $1,200 | $5,344 |
| 2019 | $244 | $6,544 | $1,200 | $5,344 |
| 2018 | $241 | $6,306 | $1,200 | $5,106 |
| 2017 | $187 | $6,306 | $1,200 | $5,106 |
| 2016 | $239 | $6,306 | $1,200 | $5,106 |
| 2015 | $246 | $6,306 | $1,200 | $5,106 |
| 2014 | $251 | $6,306 | $1,200 | $5,106 |
Source: Public Records
Map
Nearby Homes
- 251 Lang St
- 132 Lang St
- 1029 High Falls Rd
- 406 Pinelea Rd
- 911 Clayton St
- 917 E Broadway St
- 170 Jackson Ln
- 108 Jackson Ln
- 1765 High Falls Rd
- 512 Searcy Ave
- 320 Morris St
- 8 RENTALS HOUSE 712 Searcy Ave
- 127 Kennedy Rd
- 303 E Broadway St
- 715 E Chappell St
- 203 N 1st St
- 588 Elles Way
- 234 N 2nd St
- 523 E Chappell St
- 602 Circus St
- 440 Spring St
- 443 Lang St
- 448 Spring St
- 443 Spring St
- 438 Spring St
- 445 Lang St
- 437 Lang St
- 0 Spring St Unit 7047068
- 0 Spring St Unit 8624185
- 0 Spring St Unit 8093113
- 0 Spring St Unit 2733894
- 435 Lang St
- 441 Spring St
- 402 Spring St
- 447 Lang St
- 433 Lang St
- 439 Spring St
- 235 Lang St
- 400 Spring St
- 396 Spring St