Estimated Value: $1,199,000 - $1,689,000
5
Beds
5
Baths
5,438
Sq Ft
$269/Sq Ft
Est. Value
About This Home
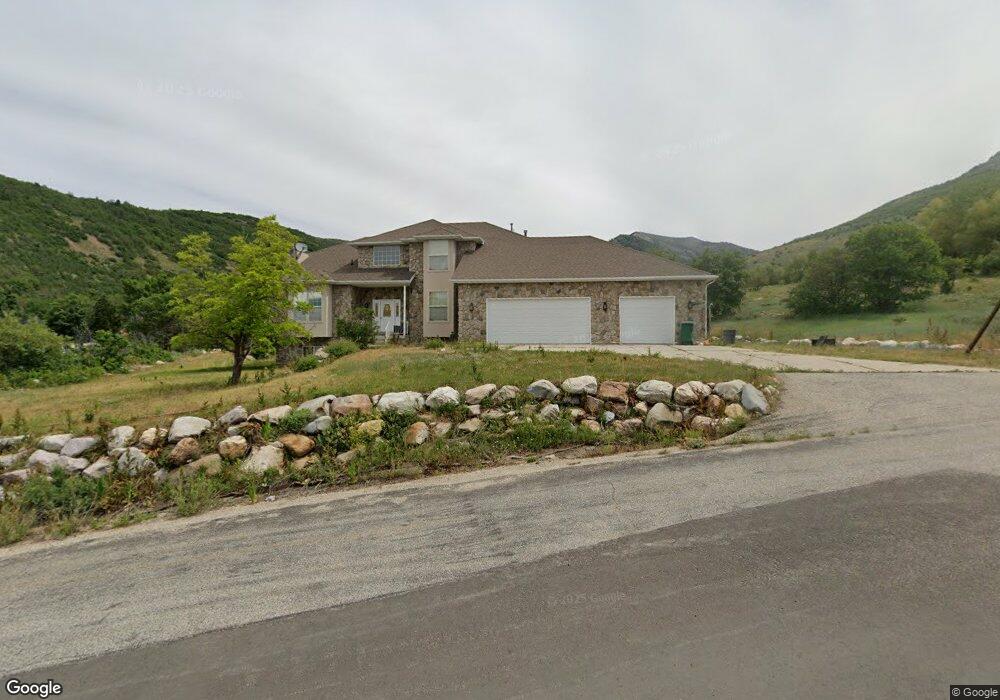
This home is located at 4460 Powder Mountain Rd, Eden, UT 84310 and is currently estimated at $1,463,983, approximately $269 per square foot. 4460 Powder Mountain Rd is a home located in Weber County with nearby schools including Valley Elementary School, Snowcrest Junior High School, and Weber High School.
Ownership History
Date
Name
Owned For
Owner Type
Purchase Details
Closed on
Jul 30, 1999
Sold by
Vandehei Jack
Bought by
Smith Dennis Hugh
Current Estimated Value
Home Financials for this Owner
Home Financials are based on the most recent Mortgage that was taken out on this home.
Original Mortgage
$240,000
Outstanding Balance
$68,914
Interest Rate
7.64%
Mortgage Type
Purchase Money Mortgage
Estimated Equity
$1,395,069
Purchase Details
Closed on
Apr 30, 1998
Sold by
Harkleroad Steve
Bought by
Vandehei Jack
Purchase Details
Closed on
May 23, 1996
Sold by
Cobabe Family Ltd Partnership
Bought by
Lewis Steve and Lewis Jan L
Purchase Details
Closed on
May 15, 1996
Sold by
Lewis Jan L and Lewis Steve
Bought by
Harkleroad Steve and Steve Harkleroad Construction
Create a Home Valuation Report for This Property
The Home Valuation Report is an in-depth analysis detailing your home's value as well as a comparison with similar homes in the area
Home Values in the Area
Average Home Value in this Area
Purchase History
| Date | Buyer | Sale Price | Title Company |
|---|---|---|---|
| Smith Dennis Hugh | -- | Associated Title | |
| Vandehei Jack | -- | -- | |
| Lewis Steve | -- | Mountain View Title | |
| Harkleroad Steve | -- | Mountain View Title |
Source: Public Records
Mortgage History
| Date | Status | Borrower | Loan Amount |
|---|---|---|---|
| Open | Smith Dennis Hugh | $240,000 | |
| Closed | Smith Dennis Hugh | $74,900 |
Source: Public Records
Tax History Compared to Growth
Tax History
| Year | Tax Paid | Tax Assessment Tax Assessment Total Assessment is a certain percentage of the fair market value that is determined by local assessors to be the total taxable value of land and additions on the property. | Land | Improvement |
|---|---|---|---|---|
| 2025 | $6,446 | $1,182,012 | $200,680 | $981,332 |
| 2024 | $5,916 | $1,101,000 | $200,695 | $900,305 |
| 2023 | $6,238 | $1,145,448 | $175,400 | $970,048 |
| 2022 | $5,394 | $1,006,578 | $150,301 | $856,277 |
| 2021 | $4,689 | $810,836 | $135,263 | $675,573 |
| 2020 | $4,226 | $672,037 | $135,311 | $536,726 |
| 2019 | $4,154 | $634,000 | $125,263 | $508,737 |
| 2018 | $4,317 | $632,901 | $125,263 | $507,638 |
| 2017 | $4,151 | $594,911 | $110,150 | $484,761 |
| 2016 | $3,914 | $303,721 | $55,179 | $248,542 |
| 2015 | $3,883 | $298,377 | $55,179 | $243,198 |
| 2014 | $3,423 | $256,345 | $55,179 | $201,166 |
Source: Public Records
Map
Nearby Homes
- 4349 N Snowflake Cir Unit 19
- 4500 N Seven Bridges Rd Unit 18
- 6822 E Aspen Ln Unit 29
- 4349 E Howe Dr Unit 241
- 4133 N Wolf Ridge Cir Unit 10
- 4634 N Seven Bridges Rd Unit 27
- 4174 N Patio Springs Dr Unit 4
- 4293 Sunrise Dr
- 4658 E 4650 N Unit 7
- 4656 E 4650 N Unit 8
- 5179 E 3900 N Unit 2
- 3880 N 4975 E Unit C207
- 3884 N 4975 E Unit B101
- 5357 E Purple Sage Dr
- 3840 N 4975 E Unit A104
- 3840 N 4975 E Unit A205
- 5409 E Purple Sage Dr Unit 10
- 3887 Sunset Cir Unit 59
- 5491 E Alpen Glow St Unit 68
- 5563 E Alpen Glow St Unit 55
- 5115 E 4450 N
- 4490 Powder Mountain Rd
- 4434 Powder Mountain Rd
- 5119 Snowflake Dr
- 4434 N Powder Mountain Rd Unit 3
- 4434 N Powder Mountain Unit 3
- 4465 Powder Mountain Rd
- 4427 Powder Mountain Rd Unit 11
- 4427 Powder Mountain Rd Unit 11
- 4408 Powder Mountain Rd Unit 6
- 4408 Powder Mountain Rd
- 4427 Powder Mountain Rd
- 4489 Powder Mountain Rd
- 4408 Powder Mountain Rd
- 5048 Snowflake Dr
- 5043 Snowflake Dr
- 4386 Powder Mountain Rd
- 5024 E Snowflake Dr N
- 5024 E Snowflake Dr N Unit 23
- 5024 N Snowflake Unit 23