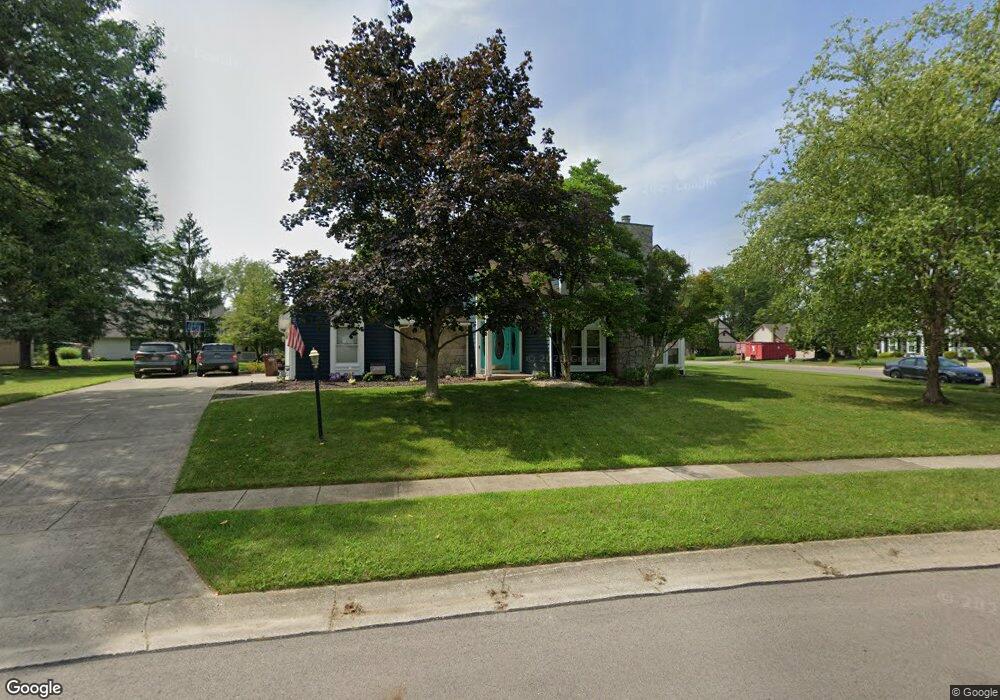
4463 Aaron Dr Dayton, OH 45440
Estimated Value: $420,000 - $491,000
4
Beds
3
Baths
3,065
Sq Ft
$151/Sq Ft
Est. Value
About This Home
This home is located at 4463 Aaron Dr, Dayton, OH 45440 and is currently estimated at $461,416, approximately $150 per square foot. 4463 Aaron Dr is a home located in Greene County with nearby schools including Bell Creek Intermediate School, Stephen Bell Elementary School, and Bellbrook Middle School.
Ownership History
Date
Name
Owned For
Owner Type
Purchase Details
Closed on
Jul 21, 2017
Sold by
Burger Barbara A
Bought by
Alban Rachele and Alban Eli
Current Estimated Value
Home Financials for this Owner
Home Financials are based on the most recent Mortgage that was taken out on this home.
Original Mortgage
$190,000
Interest Rate
3.96%
Mortgage Type
Purchase Money Mortgage
Purchase Details
Closed on
Jul 14, 2017
Sold by
Burger Patrick J
Bought by
Burger Barbara A
Home Financials for this Owner
Home Financials are based on the most recent Mortgage that was taken out on this home.
Original Mortgage
$190,000
Interest Rate
3.96%
Mortgage Type
Purchase Money Mortgage
Purchase Details
Closed on
Oct 2, 1997
Sold by
Kessler William C
Bought by
Burger Patrick J
Home Financials for this Owner
Home Financials are based on the most recent Mortgage that was taken out on this home.
Original Mortgage
$202,910
Interest Rate
7.54%
Mortgage Type
VA
Create a Home Valuation Report for This Property
The Home Valuation Report is an in-depth analysis detailing your home's value as well as a comparison with similar homes in the area
Home Values in the Area
Average Home Value in this Area
Purchase History
| Date | Buyer | Sale Price | Title Company |
|---|---|---|---|
| Alban Rachele | $210,000 | Chicago Title | |
| Burger Barbara A | -- | Chicago Title | |
| Burger Patrick J | $197,000 | -- |
Source: Public Records
Mortgage History
| Date | Status | Borrower | Loan Amount |
|---|---|---|---|
| Previous Owner | Alban Rachele | $190,000 | |
| Previous Owner | Burger Patrick J | $202,910 |
Source: Public Records
Tax History Compared to Growth
Tax History
| Year | Tax Paid | Tax Assessment Tax Assessment Total Assessment is a certain percentage of the fair market value that is determined by local assessors to be the total taxable value of land and additions on the property. | Land | Improvement |
|---|---|---|---|---|
| 2024 | $7,310 | $129,690 | $29,540 | $100,150 |
| 2023 | $7,310 | $129,690 | $29,540 | $100,150 |
| 2022 | $6,851 | $101,090 | $19,690 | $81,400 |
| 2021 | $6,928 | $101,090 | $19,690 | $81,400 |
| 2020 | $6,482 | $101,090 | $19,690 | $81,400 |
| 2019 | $6,519 | $93,280 | $14,890 | $78,390 |
| 2018 | $6,530 | $93,280 | $14,890 | $78,390 |
| 2017 | $6,372 | $93,280 | $14,890 | $78,390 |
| 2016 | $6,163 | $85,330 | $14,890 | $70,440 |
| 2015 | $6,070 | $85,330 | $14,890 | $70,440 |
| 2014 | $5,617 | $85,330 | $14,890 | $70,440 |
Source: Public Records
Map
Nearby Homes
- 3117 Swigert Rd
- 3034 Sandywood Dr
- 861 Acorn Dr
- 2841 Corlington Dr
- 2816 Corlington Dr
- 470 Cloverhill Ct
- 4901 Wilmington Pike
- 2648 Parklawn Dr
- 2579 Walford Dr
- 4824 Rean Meadow Dr
- 4533 Drayton Ct
- 364 Weathersfield Dr
- 4283 Ellason
- 4282 Galway Ct
- 4408 Glenheath Dr
- 4489 Bucksport Ct
- 4212 Seema Dr
- 4275 Galway Ct
- 3033 Glenmere Ct
- 4493 Bucksport Ct