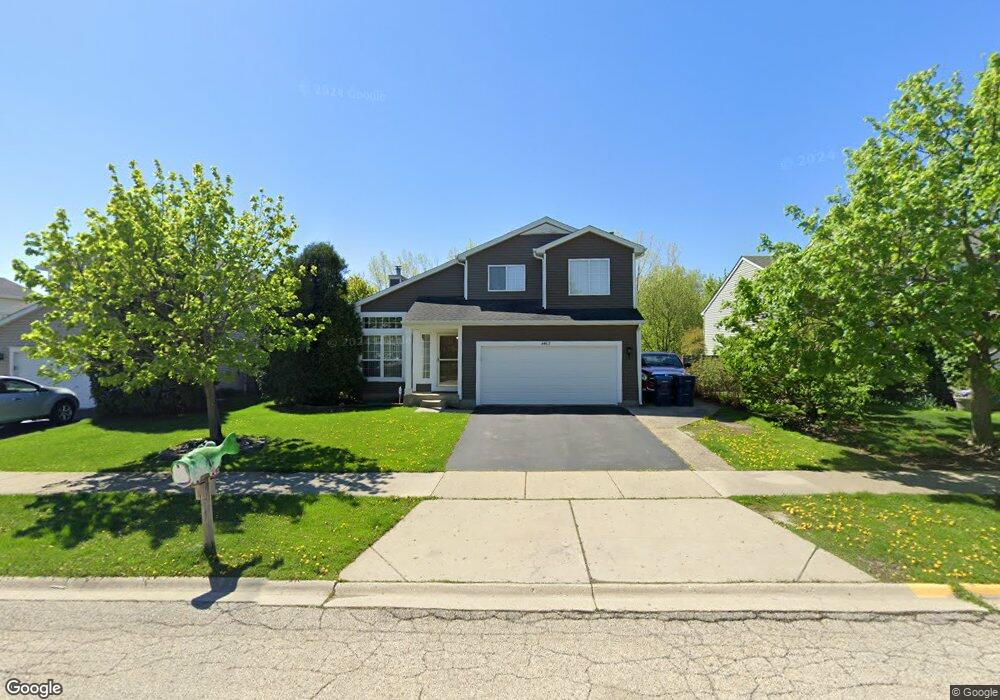
4463 W Swallowtail Dr Waukegan, IL 60085
Southwest Waukegan NeighborhoodEstimated Value: $356,000 - $407,000
3
Beds
3
Baths
1,809
Sq Ft
$213/Sq Ft
Est. Value
About This Home
This home is located at 4463 W Swallowtail Dr, Waukegan, IL 60085 and is currently estimated at $385,784, approximately $213 per square foot. 4463 W Swallowtail Dr is a home located in Lake County with nearby schools including Woodland Primary School, Woodland Elementary School, and Woodland Intermediate School.
Ownership History
Date
Name
Owned For
Owner Type
Purchase Details
Closed on
Aug 20, 2020
Sold by
Pierotti Connie
Bought by
Bernardi Carlo A and Bernardi Maxine
Current Estimated Value
Purchase Details
Closed on
Jul 6, 2010
Sold by
Bernardi Domenic
Bought by
Pierotti Connie and Bernardi Domenic
Purchase Details
Closed on
May 9, 2005
Sold by
Bernardi Carlo A and Bernardi Maxine B
Bought by
Bernardi Domenic
Home Financials for this Owner
Home Financials are based on the most recent Mortgage that was taken out on this home.
Original Mortgage
$180,000
Interest Rate
5.37%
Mortgage Type
New Conventional
Purchase Details
Closed on
Jan 17, 1995
Sold by
Pinnacle Corp
Bought by
Bernardi Carlo A and Bernardi Maxine B
Home Financials for this Owner
Home Financials are based on the most recent Mortgage that was taken out on this home.
Original Mortgage
$153,000
Interest Rate
9.28%
Create a Home Valuation Report for This Property
The Home Valuation Report is an in-depth analysis detailing your home's value as well as a comparison with similar homes in the area
Home Values in the Area
Average Home Value in this Area
Purchase History
| Date | Buyer | Sale Price | Title Company |
|---|---|---|---|
| Bernardi Carlo A | -- | None Available | |
| Pierotti Connie | -- | None Available | |
| Bernardi Domenic | $225,000 | Lawyers | |
| Bernardi Carlo A | $167,500 | Chicago Title Insurance Co |
Source: Public Records
Mortgage History
| Date | Status | Borrower | Loan Amount |
|---|---|---|---|
| Previous Owner | Bernardi Domenic | $180,000 | |
| Previous Owner | Bernardi Carlo A | $153,000 |
Source: Public Records
Tax History Compared to Growth
Tax History
| Year | Tax Paid | Tax Assessment Tax Assessment Total Assessment is a certain percentage of the fair market value that is determined by local assessors to be the total taxable value of land and additions on the property. | Land | Improvement |
|---|---|---|---|---|
| 2024 | $10,985 | $104,751 | $17,199 | $87,552 |
| 2023 | $10,985 | $97,253 | $15,968 | $81,285 |
| 2022 | $9,481 | $82,790 | $15,961 | $66,829 |
| 2021 | $8,814 | $79,469 | $15,321 | $64,148 |
| 2020 | $8,665 | $77,515 | $14,944 | $62,571 |
| 2019 | $8,548 | $75,264 | $14,510 | $60,754 |
| 2018 | $7,700 | $68,289 | $14,277 | $54,012 |
| 2017 | $7,635 | $66,332 | $13,868 | $52,464 |
| 2016 | $7,532 | $63,379 | $13,251 | $50,128 |
| 2015 | $7,438 | $60,109 | $12,567 | $47,542 |
| 2014 | $8,009 | $61,660 | $12,397 | $49,263 |
| 2012 | $7,455 | $65,482 | $12,502 | $52,980 |
Source: Public Records
Map
Nearby Homes
- 4482 W Tucker Ln
- 4390 W Parkway Ave
- 4520 W Lawn Ave
- 4437-4495 W Kennedy Dr
- 4363 W Kennedy Dr
- 1627 S Candlestick Way Unit 3283
- 4185 Eastwood Place
- 601 Lakehurst Rd
- 662 Waterbury Ave
- 33564 Greenleaf St
- 468 Tanglewood Dr
- 450 Tanglewood Dr
- 4586 Covenant Ct
- 498 Calvin Ct
- 0 Northwoods Ave Unit MRD11938775
- 00 Northwood Ave
- 4829 Kings Way W
- 14314 Towne Trail
- 334 Concord Square
- 424 Greenview Dr
- 4455 W Swallowtail Dr
- 4471 W Swallowtail Dr
- 4447 W Swallowtail Dr Unit 1
- 4479 W Swallowtail Dr Unit 1
- 4487 W Swallowtail Dr Unit 1
- 4439 W Swallowtail Dr Unit 1
- 4472 W Swallowtail Dr
- 4464 W Swallowtail Dr
- 4480 W Swallowtail Dr
- 4456 W Swallowtail Dr
- 4488 W Swallowtail Dr
- 4495 W Swallowtail Dr
- 4496 W Swallowtail Dr
- 4448 W Swallowtail Dr
- 4503 W Swallowtail Dr
- 4504 W Swallowtail Dr Unit 1
- 4469 W Roundstone Way
- 4461 W Roundstone Way
- 4477 W Roundstone Way
- 4485 W Roundstone Way