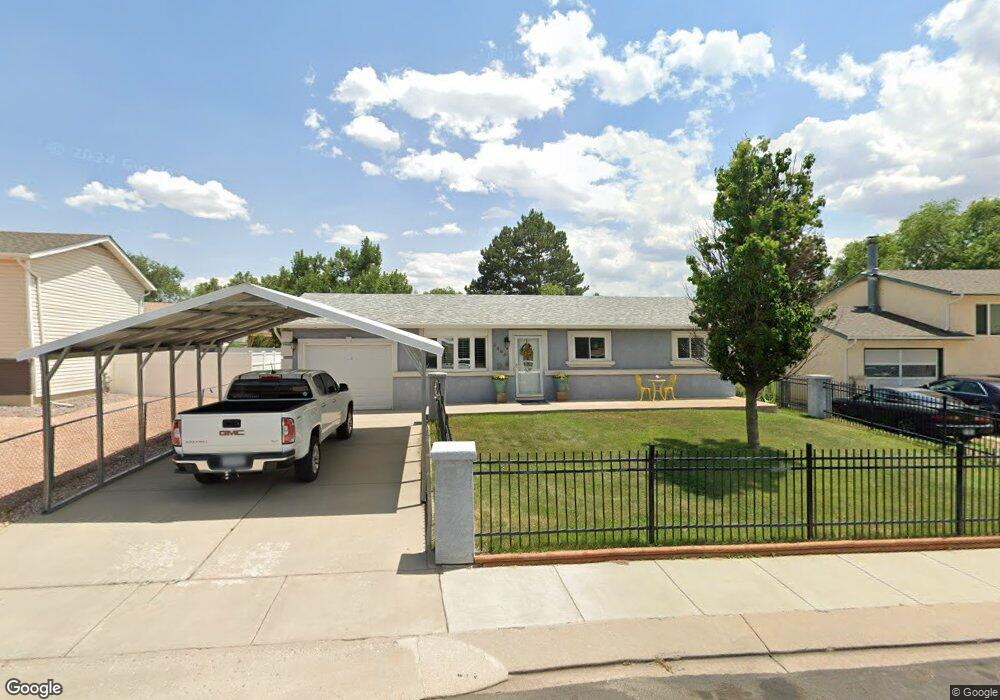
4465 Anjelina Cir N Colorado Springs, CO 80916
Gateway Park NeighborhoodEstimated Value: $305,000 - $347,000
3
Beds
1
Bath
943
Sq Ft
$339/Sq Ft
Est. Value
About This Home
This home is located at 4465 Anjelina Cir N, Colorado Springs, CO 80916 and is currently estimated at $320,055, approximately $339 per square foot. 4465 Anjelina Cir N is a home located in El Paso County with nearby schools including Bricker Elementary School, Panorama Middle School, and Sierra High School.
Ownership History
Date
Name
Owned For
Owner Type
Purchase Details
Closed on
Sep 9, 2011
Sold by
Quintana Patsy D and Quintana Dennis
Bought by
Patsy D Quintana Living Trust and Dennis Quinta Living Trust
Current Estimated Value
Purchase Details
Closed on
Dec 15, 2005
Sold by
Quintana Dennis E
Bought by
Quintana Patsy D and Quintana Dennis E
Purchase Details
Closed on
Jan 24, 2003
Sold by
Heinz Kimberly L
Bought by
Krueger Larry A and Krueger Sandra J
Home Financials for this Owner
Home Financials are based on the most recent Mortgage that was taken out on this home.
Original Mortgage
$82,400
Interest Rate
6%
Purchase Details
Closed on
Nov 30, 1994
Sold by
Martin Cleopatra H
Bought by
Quintana Dennis E
Home Financials for this Owner
Home Financials are based on the most recent Mortgage that was taken out on this home.
Original Mortgage
$62,200
Interest Rate
8%
Mortgage Type
VA
Purchase Details
Closed on
Mar 1, 1986
Bought by
Quintana Dennis Living Trust
Create a Home Valuation Report for This Property
The Home Valuation Report is an in-depth analysis detailing your home's value as well as a comparison with similar homes in the area
Home Values in the Area
Average Home Value in this Area
Purchase History
| Date | Buyer | Sale Price | Title Company |
|---|---|---|---|
| Patsy D Quintana Living Trust | -- | None Available | |
| Quintana Patsy D | -- | -- | |
| Krueger Larry A | $103,800 | Security Title | |
| Quintana Dennis E | $61,000 | Security Title | |
| Quintana Dennis Living Trust | -- | -- |
Source: Public Records
Mortgage History
| Date | Status | Borrower | Loan Amount |
|---|---|---|---|
| Closed | Krueger Larry A | $82,400 | |
| Previous Owner | Quintana Dennis E | $62,200 |
Source: Public Records
Tax History Compared to Growth
Tax History
| Year | Tax Paid | Tax Assessment Tax Assessment Total Assessment is a certain percentage of the fair market value that is determined by local assessors to be the total taxable value of land and additions on the property. | Land | Improvement |
|---|---|---|---|---|
| 2025 | $1,135 | $23,510 | -- | -- |
| 2024 | $531 | $23,350 | $3,580 | $19,770 |
| 2023 | $531 | $23,350 | $3,580 | $19,770 |
| 2022 | $474 | $15,730 | $3,130 | $12,600 |
| 2021 | $505 | $16,180 | $3,220 | $12,960 |
| 2020 | $387 | $11,880 | $2,500 | $9,380 |
| 2019 | $375 | $11,880 | $2,500 | $9,380 |
| 2018 | $301 | $9,160 | $1,800 | $7,360 |
| 2017 | $230 | $9,160 | $1,800 | $7,360 |
| 2016 | $243 | $9,110 | $1,830 | $7,280 |
| 2015 | $243 | $9,110 | $1,830 | $7,280 |
| 2014 | $219 | $8,100 | $1,830 | $6,270 |
Source: Public Records
Map
Nearby Homes
- 4485 Carolyn Dr
- 4560 Barkman Cir
- 4565 Barkman Cir
- 2438 Barkman Dr
- 4150 Shining Way
- 4243 Gatewood Dr
- 4527 Lamplighter Cir Unit 3
- 4537 Lamplighter Cir Unit 4
- 2335 Cather Cir
- 2438 Lexington Village Ln Unit M6
- 2575 Nadine Dr
- 2521 Astrozon Cir
- 2455 Lexington Village Ln Unit 3
- 2467 Lexington Village Ln Unit G3
- 2233 Farnsworth Dr
- 1945 Harwood Cir
- 4323 Hunting Meadows Cir Unit 5
- 4338 Hunting Meadows Cir Unit S5
- 4435 Hunting Meadows Cir Unit O8
- 4475 London Ln
- 4455 Anjelina Cir N
- 4475 Anjelina Cir N
- 4480 Carolyn Dr
- 4490 Carolyn Dr
- 4445 Anjelina Cir N
- 4470 Carolyn Dr
- 4460 Anjelina Cir N
- 4450 Anjelina Cir N
- 4435 Anjelina Cir N
- 4470 Anjelina Cir N
- 4450 Carolyn Dr
- 4440 Anjelina Cir N
- 4425 Anjelina Cir N
- 4440 Carolyn Dr
- 4425 Barkman Cir
- 4430 Anjelina Cir N
- 4512 Barkman Cir
- 4435 Barkman Cir
- 4421 Barkman Cir
- 4446 Barkman Cir