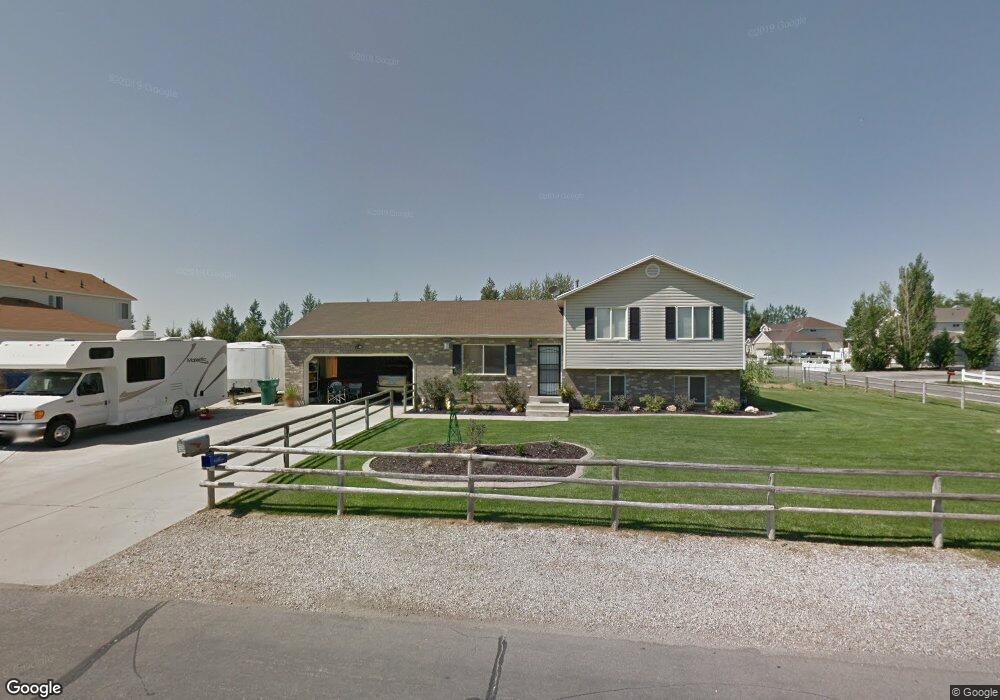
4465 S 4100 W West Haven, UT 84401
Estimated Value: $488,000 - $634,125
3
Beds
3
Baths
1,780
Sq Ft
$317/Sq Ft
Est. Value
About This Home
This home is located at 4465 S 4100 W, West Haven, UT 84401 and is currently estimated at $564,531, approximately $317 per square foot. 4465 S 4100 W is a home located in Weber County with nearby schools including West Haven School, Sand Ridge Junior High School, and Roy High School.
Ownership History
Date
Name
Owned For
Owner Type
Purchase Details
Closed on
Jun 2, 2015
Sold by
Carter Christopher J and Carter Joann W
Bought by
The Carter Family Trust
Current Estimated Value
Purchase Details
Closed on
Oct 7, 2009
Sold by
Gibbs Matt G and Gibbs Sherry J
Bought by
Carter Christopher J
Home Financials for this Owner
Home Financials are based on the most recent Mortgage that was taken out on this home.
Original Mortgage
$146,500
Outstanding Balance
$95,516
Interest Rate
5.05%
Mortgage Type
New Conventional
Estimated Equity
$469,015
Purchase Details
Closed on
Mar 30, 2004
Sold by
Chatelain Bart C and Chatelain Jayme K
Bought by
Gibbs Matt G
Purchase Details
Closed on
May 16, 1996
Sold by
Chatelain Bart C and Bader Jayme K
Bought by
Chatelain Bart C
Home Financials for this Owner
Home Financials are based on the most recent Mortgage that was taken out on this home.
Original Mortgage
$116,053
Interest Rate
7.8%
Mortgage Type
FHA
Create a Home Valuation Report for This Property
The Home Valuation Report is an in-depth analysis detailing your home's value as well as a comparison with similar homes in the area
Home Values in the Area
Average Home Value in this Area
Purchase History
| Date | Buyer | Sale Price | Title Company |
|---|---|---|---|
| The Carter Family Trust | -- | None Available | |
| Carter Christopher J | -- | Lincoln Title Ins Agency | |
| Gibbs Matt G | -- | Us Title | |
| Chatelain Bart C | -- | Bonneville Title | |
| Chatelain Bart C | -- | Bonneville Title | |
| Sessions Scott | -- | Bonneville Title |
Source: Public Records
Mortgage History
| Date | Status | Borrower | Loan Amount |
|---|---|---|---|
| Open | Carter Christopher J | $146,500 | |
| Previous Owner | Chatelain Bart C | $116,053 |
Source: Public Records
Tax History Compared to Growth
Tax History
| Year | Tax Paid | Tax Assessment Tax Assessment Total Assessment is a certain percentage of the fair market value that is determined by local assessors to be the total taxable value of land and additions on the property. | Land | Improvement |
|---|---|---|---|---|
| 2025 | $1,655 | $560,347 | $177,000 | $383,347 |
| 2024 | $1,539 | $345,508 | $97,350 | $248,158 |
| 2023 | $1,572 | $365,827 | $97,350 | $268,477 |
| 2022 | $1,677 | $613,999 | $177,000 | $436,999 |
| 2021 | $1,647 | $484,998 | $91,124 | $393,874 |
| 2020 | $1,411 | $427,001 | $76,512 | $350,489 |
| 2019 | $1,330 | $385,001 | $77,504 | $307,497 |
| 2018 | $1,239 | $368,999 | $63,553 | $305,446 |
| 2017 | $1,111 | $303,001 | $64,666 | $238,335 |
| 2016 | $959 | $155,916 | $28,904 | $127,012 |
| 2015 | $916 | $149,869 | $28,904 | $120,965 |
| 2014 | $817 | $135,014 | $28,904 | $106,110 |
Source: Public Records
Map
Nearby Homes
- 4024 W 4650 S
- 4094 W 4700 S
- 4097 W 4750 S
- 4756 S 4300 W
- 4106 W 4875 S
- 4141 W 4875 S
- 3692 W 4625 S
- Villages Townhome Plan at Green Farm - Villages
- 4080 W 4000 S
- 3652 W 4625 S
- 3671 W 4700 S
- 3984 W 4000 S
- 4990 S 4075 W
- 3632 W 4650 S
- 3627 W 4650 S
- 5013 S 4150 W
- 4021 W 5000 S
- 4218 W 5050 S
- 3610 W 4475 S
- 4556 W 4950 S