Estimated Value: $452,789 - $504,000
4
Beds
4
Baths
3,300
Sq Ft
$148/Sq Ft
Est. Value
About This Home
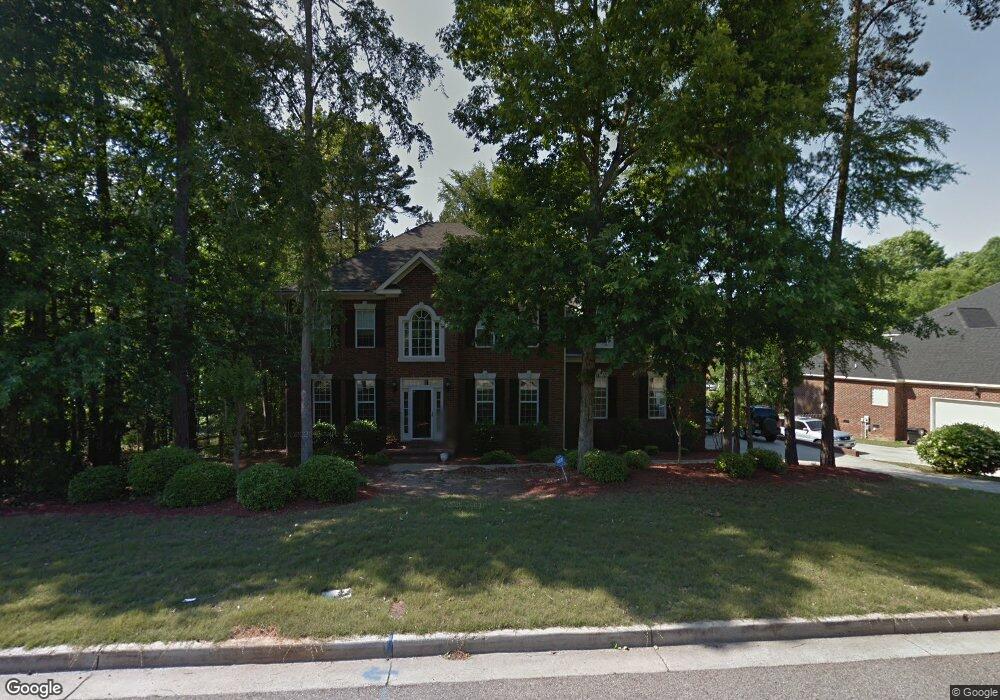
This home is located at 4467 Cape Cod Dr, Evans, GA 30809 and is currently estimated at $487,947, approximately $147 per square foot. 4467 Cape Cod Dr is a home located in Columbia County with nearby schools including River Ridge Elementary School, Riverside Middle School, and Lakeside High School.
Ownership History
Date
Name
Owned For
Owner Type
Purchase Details
Closed on
Nov 27, 2006
Sold by
Bhale Ajay
Bought by
Patel Pravin D
Current Estimated Value
Purchase Details
Closed on
May 30, 2003
Sold by
Robbins Curtis F and Robbins Pamela J
Bought by
Bhale Ajay
Home Financials for this Owner
Home Financials are based on the most recent Mortgage that was taken out on this home.
Original Mortgage
$200,000
Interest Rate
5.02%
Mortgage Type
Purchase Money Mortgage
Purchase Details
Closed on
Sep 28, 2001
Sold by
Bailey Robert Todd
Bought by
Robbins Curtis F and Robbins Pamela J
Home Financials for this Owner
Home Financials are based on the most recent Mortgage that was taken out on this home.
Original Mortgage
$238,400
Interest Rate
6.89%
Mortgage Type
VA
Purchase Details
Closed on
Feb 1, 2001
Sold by
North Belair Ventures Lp
Bought by
Bailey Robert Todd
Create a Home Valuation Report for This Property
The Home Valuation Report is an in-depth analysis detailing your home's value as well as a comparison with similar homes in the area
Home Values in the Area
Average Home Value in this Area
Purchase History
| Date | Buyer | Sale Price | Title Company |
|---|---|---|---|
| Patel Pravin D | $287,000 | -- | |
| Bhale Ajay | $263,500 | -- | |
| Robbins Curtis F | $250,200 | -- | |
| Bailey Robert Todd | $22,500 | -- |
Source: Public Records
Mortgage History
| Date | Status | Borrower | Loan Amount |
|---|---|---|---|
| Previous Owner | Bhale Ajay | $200,000 | |
| Previous Owner | Robbins Curtis F | $238,400 |
Source: Public Records
Tax History
| Year | Tax Paid | Tax Assessment Tax Assessment Total Assessment is a certain percentage of the fair market value that is determined by local assessors to be the total taxable value of land and additions on the property. | Land | Improvement |
|---|---|---|---|---|
| 2025 | $1,383 | $175,974 | $30,704 | $145,270 |
| 2024 | $1,506 | $185,570 | $35,504 | $150,066 |
| 2023 | $3,802 | $166,628 | $31,004 | $135,624 |
| 2022 | $3,985 | $153,089 | $29,004 | $124,085 |
| 2021 | $3,763 | $138,237 | $24,304 | $113,933 |
| 2020 | $3,641 | $131,013 | $24,304 | $106,709 |
| 2019 | $3,503 | $126,036 | $22,004 | $104,032 |
| 2018 | $3,405 | $122,071 | $21,604 | $100,467 |
| 2017 | $3,396 | $121,338 | $21,704 | $99,634 |
| 2016 | $3,147 | $114,597 | $20,880 | $93,717 |
| 2015 | $3,192 | $116,061 | $19,580 | $96,481 |
| 2014 | $3,124 | $112,106 | $19,680 | $92,426 |
Source: Public Records
Map
Nearby Homes
- 4478 Cape Cod Dr
- 4418 Pierwood Way
- 829 Woodberry Dr
- 929 Burlington Dr
- 644 Deerwood Way
- 4484 Woodberry Ct
- 4489 Woodberry Ct
- 802 Sparkleberry Rd
- 656 Deerwood Way
- 800 Sparkleberry Rd
- 809 Woodberry Dr
- 4449 Pierwood Way
- 672 Deerwood Way
- 854 Sparkleberry Rd
- 4222 Deerwood Ln
- 726 Whitney Shoals Rd
- 881 Audubon Way
- 814 Audubon Way
- 648 River Oaks Ln
- 936 Deercrest Cir
- 4465 Cape Cod Dr
- 808 Nashua Ct
- 4469 Cape Cod Dr
- 4463 Cape Cod Dr
- 4462 Cape Cod Dr
- 807 Nashua Ct
- 4466 Cape Cod Dr
- 4468 Cape Cod Dr
- 810 Nashua Ct
- 4464 Cape Cod Dr
- 4473 Cape Cod Dr
- 4460 Cape Cod Dr
- 4470 Cape Cod Dr
- 4461 Cape Cod Dr
- 892 Sturbridge Ct
- 812 Nashua Ct
- 809 Nashua Ct
- 894 Sturbridge Ct
- 4472 Cape Cod Dr
- 4475 Cape Cod Dr
Your Personal Tour Guide
Ask me questions while you tour the home.