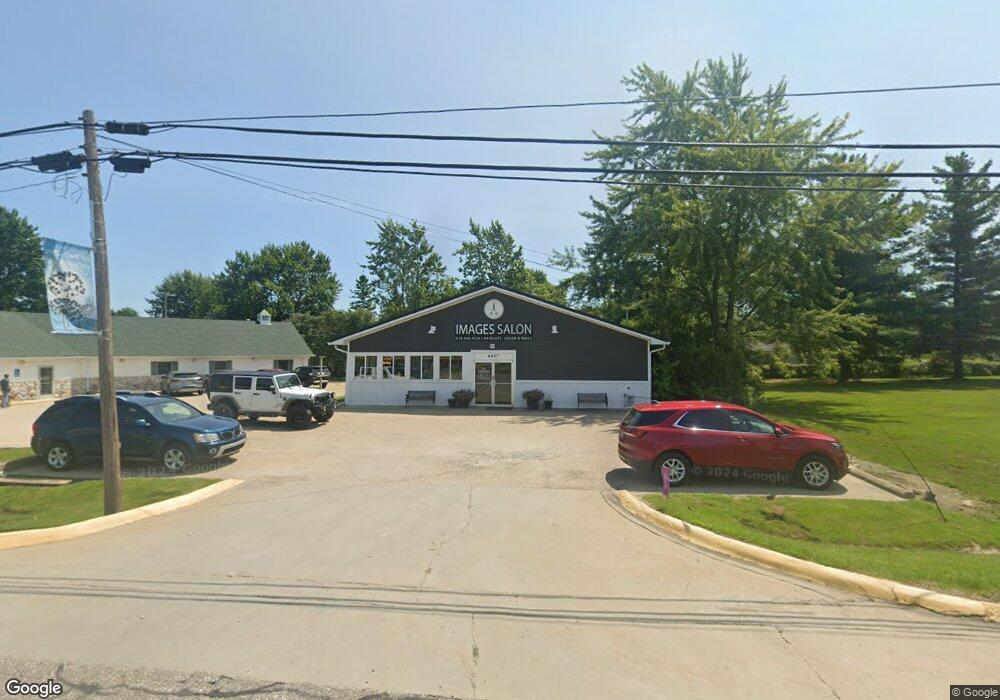
4467 Main St Brown City, MI 48416
--
Bed
--
Bath
3,514
Sq Ft
9,583
Sq Ft Lot
About This Home
This home is located at 4467 Main St, Brown City, MI 48416. 4467 Main St is a home located in Sanilac County with nearby schools including Brown City Elementary School and Brown City High School.
Ownership History
Date
Name
Owned For
Owner Type
Purchase Details
Closed on
Apr 3, 2015
Sold by
Talmer Bank
Bought by
Roberts Scott and Geri Lynn
Purchase Details
Closed on
Aug 23, 2012
Sold by
Jessica and Sanilac County Sheriffs Depart
Bought by
Talmer Bank And Trust and First Michigan Bank
Purchase Details
Closed on
Mar 8, 2007
Bought by
Flying Colours Inc
Purchase Details
Closed on
Nov 30, 2001
Sold by
Bender Timothy A
Bought by
Pet Cetera 2 Llc
Purchase Details
Closed on
Jul 13, 1999
Sold by
Siegler Lorelei Trott
Bought by
Siegler James L
Purchase Details
Closed on
Dec 20, 1996
Sold by
Kraft Raymond and Kraft Wilma
Bought by
Bender Timothy
Purchase Details
Closed on
Jan 9, 1996
Sold by
Kraft Dr H R
Bought by
Bender Timothy A
Create a Home Valuation Report for This Property
The Home Valuation Report is an in-depth analysis detailing your home's value as well as a comparison with similar homes in the area
Home Values in the Area
Average Home Value in this Area
Purchase History
| Date | Buyer | Sale Price | Title Company |
|---|---|---|---|
| Roberts Scott | $41,000 | -- | |
| Talmer Bank And Trust | $111,110 | -- | |
| Flying Colours Inc | $141,000 | -- | |
| Pet Cetera 2 Llc | $92,000 | -- | |
| Siegler James L | -- | -- | |
| Bender Timothy | $14,000 | -- | |
| Bender Timothy A | $14,000 | -- |
Source: Public Records
Tax History Compared to Growth
Tax History
| Year | Tax Paid | Tax Assessment Tax Assessment Total Assessment is a certain percentage of the fair market value that is determined by local assessors to be the total taxable value of land and additions on the property. | Land | Improvement |
|---|---|---|---|---|
| 2025 | $3,737 | $63,969 | $0 | $0 |
| 2024 | $619 | $61,030 | $0 | $0 |
| 2023 | $612 | $60,698 | $0 | $0 |
| 2022 | $3,474 | $65,887 | $0 | $0 |
| 2021 | $1,128 | $67,936 | $0 | $0 |
| 2020 | $3,329 | $67,913 | $0 | $0 |
| 2019 | $3,215 | $60,670 | $0 | $0 |
| 2018 | $3,135 | $52,821 | $0 | $0 |
| 2017 | $522 | $51,453 | $0 | $0 |
| 2016 | $540 | $53,251 | $0 | $0 |
| 2015 | -- | $48,881 | $0 | $0 |
| 2014 | -- | $50,439 | $0 | $0 |
Source: Public Records
Map
Nearby Homes