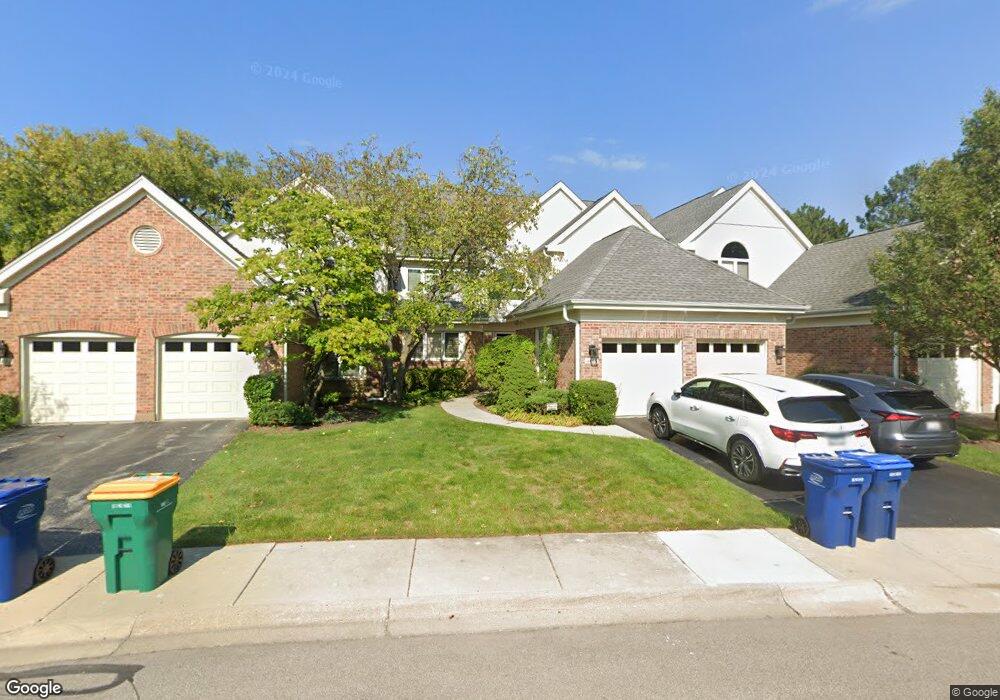
4468 4 Winds Ln Northbrook, IL 60062
Estimated Value: $609,437 - $703,000
3
Beds
3
Baths
2,698
Sq Ft
$239/Sq Ft
Est. Value
About This Home
This home is located at 4468 4 Winds Ln, Northbrook, IL 60062 and is currently estimated at $644,859, approximately $239 per square foot. 4468 4 Winds Ln is a home located in Cook County with nearby schools including Walt Whitman Elementary School, Oliver W Holmes Middle School, and Wheeling High School.
Ownership History
Date
Name
Owned For
Owner Type
Purchase Details
Closed on
Nov 18, 1999
Sold by
Hirsch Barry
Bought by
Horne Hirsch Barry and Horne Hirsch Teri
Current Estimated Value
Purchase Details
Closed on
Jun 3, 1999
Sold by
Feinerman Steven and Feinerman Bette A
Bought by
Hirsch Barry M
Home Financials for this Owner
Home Financials are based on the most recent Mortgage that was taken out on this home.
Original Mortgage
$135,000
Outstanding Balance
$35,428
Interest Rate
6.99%
Mortgage Type
Purchase Money Mortgage
Estimated Equity
$609,431
Purchase Details
Closed on
Mar 25, 1994
Sold by
Feinerman Bette A and Feinerman Steven
Bought by
Feinerman Steven and Feinerman Bette A
Home Financials for this Owner
Home Financials are based on the most recent Mortgage that was taken out on this home.
Original Mortgage
$252,000
Interest Rate
7.17%
Mortgage Type
Purchase Money Mortgage
Purchase Details
Closed on
Dec 31, 1993
Sold by
Feinerman Steven and Feinerman Bette A
Bought by
Feinerman Bette A
Create a Home Valuation Report for This Property
The Home Valuation Report is an in-depth analysis detailing your home's value as well as a comparison with similar homes in the area
Home Values in the Area
Average Home Value in this Area
Purchase History
| Date | Buyer | Sale Price | Title Company |
|---|---|---|---|
| Horne Hirsch Barry | -- | Chicago Title Insurance Co | |
| Hirsch Barry M | $378,000 | -- | |
| Feinerman Steven | -- | -- | |
| Feinerman Bette A | -- | -- |
Source: Public Records
Mortgage History
| Date | Status | Borrower | Loan Amount |
|---|---|---|---|
| Open | Hirsch Barry M | $135,000 | |
| Previous Owner | Feinerman Steven | $252,000 |
Source: Public Records
Tax History Compared to Growth
Tax History
| Year | Tax Paid | Tax Assessment Tax Assessment Total Assessment is a certain percentage of the fair market value that is determined by local assessors to be the total taxable value of land and additions on the property. | Land | Improvement |
|---|---|---|---|---|
| 2024 | $13,724 | $45,867 | $7,500 | $38,367 |
| 2023 | $13,116 | $45,867 | $7,500 | $38,367 |
| 2022 | $13,116 | $45,867 | $7,500 | $38,367 |
| 2021 | $12,750 | $38,837 | $10,698 | $28,139 |
| 2020 | $12,436 | $38,837 | $10,698 | $28,139 |
| 2019 | $12,614 | $43,491 | $10,698 | $32,793 |
| 2018 | $11,030 | $34,489 | $9,263 | $25,226 |
| 2017 | $10,771 | $34,489 | $9,263 | $25,226 |
| 2016 | $11,317 | $38,962 | $9,263 | $29,699 |
| 2015 | $11,503 | $36,542 | $8,089 | $28,453 |
| 2014 | $11,270 | $36,542 | $8,089 | $28,453 |
| 2013 | $10,440 | $36,542 | $8,089 | $28,453 |
Source: Public Records
Map
Nearby Homes
- 25 Wellesley Cir Unit 64
- 320 Buckthorn Cir
- 4146 Cardinal Ct
- 2514 Shoal Creek Ct
- 4226 Henry Way
- 717 Sarah Ln
- 4050 Dundee Rd Unit 203K
- 4050 Dundee Rd Unit 205K
- 3030 Orange Brace Rd
- 2260 Congressional Ln
- 325 Shadowbend Dr Unit 3B
- 321 Forestway Ln Unit 3B
- 0 Deerfield Rd
- 455 Laburnum Dr
- 3549 Bayberry Dr
- 190 N Milwaukee Ave Unit 3604
- 2419 Riverwoods Rd
- 92 Legacy Ln
- 4003 Yorkshire Ln
- 241 S Milwaukee Ave
- 4464 4 Winds Ln
- 4478 Fourwinds Ln
- 4478 4 Winds Ln
- 4420 4 Winds Ln
- 4436 4 Winds Ln
- 4422 4 Winds Ln
- 4469 4 Winds Ln
- 4418 4 Winds Ln
- 4484 4 Winds Ln
- 4463 4 Winds Ln
- 4459 4 Winds Ln
- 4416 4 Winds Ln
- 3 Caribou Crossing
- 7 Caribou Crossing
- 11 Caribou Crossing
- 4437 4 Winds Ln
- 4408 4 Winds Ln
- 4408 Four Winds Ln Unit 4408
- 4441 4 Winds Ln
- 4453 4 Winds Ln