Estimated Value: $275,000 - $361,000
3
Beds
2
Baths
1,692
Sq Ft
$181/Sq Ft
Est. Value
About This Home
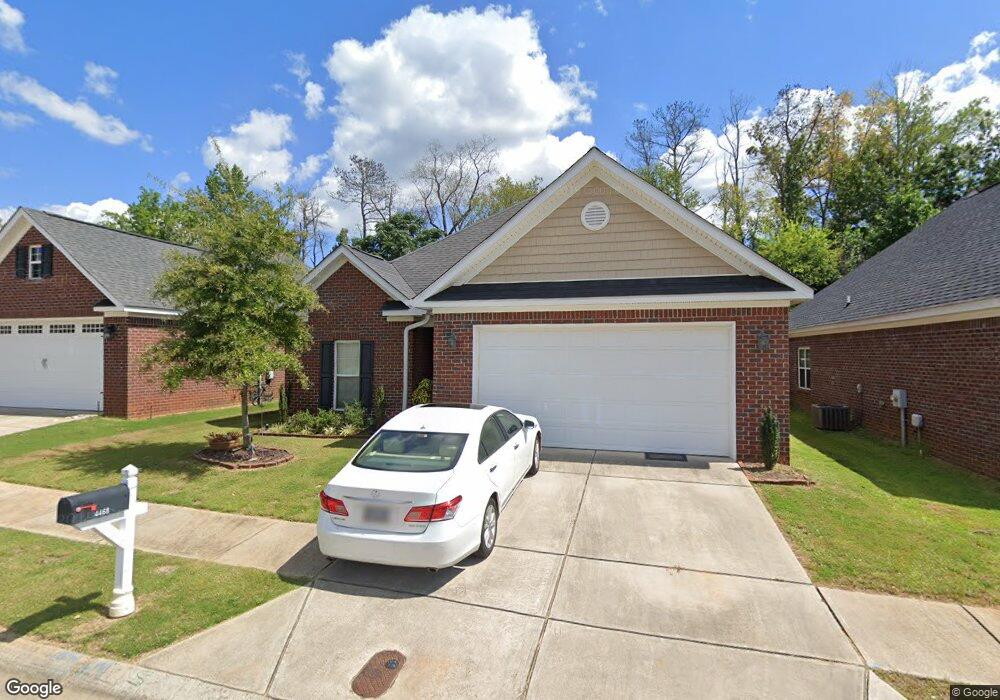
This home is located at 4468 Galway Dr, Evans, GA 30809 and is currently estimated at $305,664, approximately $180 per square foot. 4468 Galway Dr is a home located in Columbia County with nearby schools including Evans Elementary School, Evans Middle School, and Evans High School.
Ownership History
Date
Name
Owned For
Owner Type
Purchase Details
Closed on
Oct 16, 2009
Sold by
Tommy Rennison Home Bldrs Inc
Bought by
Sanders Barbara
Current Estimated Value
Home Financials for this Owner
Home Financials are based on the most recent Mortgage that was taken out on this home.
Original Mortgage
$115,000
Interest Rate
5.04%
Mortgage Type
New Conventional
Purchase Details
Closed on
Mar 20, 2009
Sold by
Jim Davis Co
Bought by
Tommy Rennison Hombldrs Inc
Home Financials for this Owner
Home Financials are based on the most recent Mortgage that was taken out on this home.
Original Mortgage
$140,000
Interest Rate
5.1%
Mortgage Type
New Conventional
Purchase Details
Closed on
Mar 9, 2009
Sold by
Connemara Llc
Bought by
Jim Davis Co
Home Financials for this Owner
Home Financials are based on the most recent Mortgage that was taken out on this home.
Original Mortgage
$140,000
Interest Rate
5.1%
Mortgage Type
New Conventional
Create a Home Valuation Report for This Property
The Home Valuation Report is an in-depth analysis detailing your home's value as well as a comparison with similar homes in the area
Home Values in the Area
Average Home Value in this Area
Purchase History
| Date | Buyer | Sale Price | Title Company |
|---|---|---|---|
| Sanders Barbara | $165,000 | -- | |
| Tommy Rennison Hombldrs Inc | $38,700 | -- | |
| Jim Davis Co | $190,000 | -- |
Source: Public Records
Mortgage History
| Date | Status | Borrower | Loan Amount |
|---|---|---|---|
| Closed | Sanders Barbara | $115,000 | |
| Previous Owner | Tommy Rennison Hombldrs Inc | $140,000 | |
| Previous Owner | Jim Davis Co | $114,250 |
Source: Public Records
Tax History
| Year | Tax Paid | Tax Assessment Tax Assessment Total Assessment is a certain percentage of the fair market value that is determined by local assessors to be the total taxable value of land and additions on the property. | Land | Improvement |
|---|---|---|---|---|
| 2025 | $995 | $124,909 | $29,804 | $95,105 |
| 2024 | $909 | $109,712 | $19,104 | $90,608 |
| 2023 | $909 | $92,638 | $18,404 | $74,234 |
| 2022 | $785 | $85,915 | $17,804 | $68,111 |
| 2021 | $709 | $73,350 | $13,604 | $59,746 |
| 2020 | $2,098 | $73,444 | $13,404 | $60,040 |
| 2019 | $2,066 | $72,311 | $13,404 | $58,907 |
| 2018 | $2,076 | $72,433 | $13,604 | $58,829 |
| 2017 | $2,057 | $71,495 | $13,304 | $58,191 |
| 2016 | $1,946 | $70,023 | $12,580 | $57,443 |
| 2015 | $1,892 | $67,871 | $12,580 | $55,291 |
| 2014 | $1,871 | $66,286 | $13,780 | $52,506 |
Source: Public Records
Map
Nearby Homes
- 625 Dunloe Cir
- 4421 Hereford Farm Rd
- 456 Connemara Trail
- 525 Pheasant Run Dr
- 4367 Ballentine Dr
- 4560 Mulberry Creek Dr
- 4403 Owens Rd
- 245 Belair Rd N
- 4517 Glennwood Dr
- 4535 Glenda Ln
- 648 River Oaks Ln
- 2820 Old Riah Rd
- 4622 Brittany Dr
- 213 N Belair Rd
- 5068 Hereford Farm Rd
- 193 Creek View Cir
- 854 Sparkleberry Rd
- 108 Whetstone Ct
- 435 Evans Mill Dr Unit 17
- 4441 Shadowmoor Dr
Your Personal Tour Guide
Ask me questions while you tour the home.