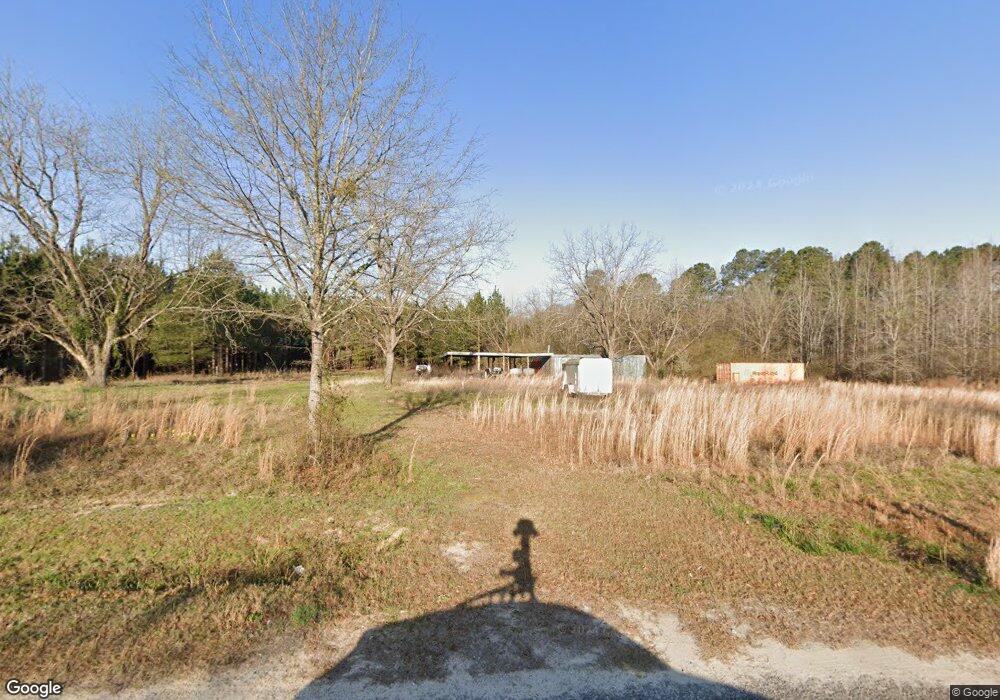
4469 Langham Rd Thomson, GA 30824
Estimated Value: $73,127 - $212,000
--
Bed
1
Bath
1,309
Sq Ft
$107/Sq Ft
Est. Value
About This Home
This home is located at 4469 Langham Rd, Thomson, GA 30824 and is currently estimated at $140,532, approximately $107 per square foot. 4469 Langham Rd is a home located in McDuffie County with nearby schools including Thomson High School.
Ownership History
Date
Name
Owned For
Owner Type
Purchase Details
Closed on
Feb 17, 2022
Sold by
Faglier Kenneth V
Bought by
Faglier Kenneth V and Faglier Sharon W
Current Estimated Value
Purchase Details
Closed on
Nov 20, 2018
Sold by
Tribble Geneva
Bought by
Faglier Kenneth
Home Financials for this Owner
Home Financials are based on the most recent Mortgage that was taken out on this home.
Original Mortgage
$18,000
Interest Rate
4.8%
Mortgage Type
New Conventional
Purchase Details
Closed on
Jul 7, 2017
Sold by
Newsome Floyd B
Bought by
Tribble Geneva
Purchase Details
Closed on
Oct 30, 2010
Sold by
Newsome Floyd Doyle
Bought by
Newsome Floyd Branard
Purchase Details
Closed on
Jun 30, 2008
Sold by
Rogers Lessie
Bought by
Rogers Al Roy
Purchase Details
Closed on
Jul 12, 2000
Sold by
Newsome Joseph E
Bought by
Newsome Floyd D
Purchase Details
Closed on
Sep 26, 1996
Sold by
Newsome Robert W
Bought by
Newsome Joseph E
Purchase Details
Closed on
Aug 28, 1985
Bought by
Newsome Robert W
Create a Home Valuation Report for This Property
The Home Valuation Report is an in-depth analysis detailing your home's value as well as a comparison with similar homes in the area
Home Values in the Area
Average Home Value in this Area
Purchase History
| Date | Buyer | Sale Price | Title Company |
|---|---|---|---|
| Faglier Kenneth V | -- | -- | |
| Faglier Kenneth | $20,000 | -- | |
| Tribble Geneva | $8,500 | -- | |
| Newsome Floyd Branard | -- | -- | |
| Rogers Al Roy | -- | -- | |
| Newsome Floyd D | $20,000 | -- | |
| Newsome Joseph E | -- | -- | |
| Newsome Robert W | -- | -- |
Source: Public Records
Mortgage History
| Date | Status | Borrower | Loan Amount |
|---|---|---|---|
| Previous Owner | Faglier Kenneth | $18,000 |
Source: Public Records
Tax History Compared to Growth
Tax History
| Year | Tax Paid | Tax Assessment Tax Assessment Total Assessment is a certain percentage of the fair market value that is determined by local assessors to be the total taxable value of land and additions on the property. | Land | Improvement |
|---|---|---|---|---|
| 2024 | $97 | $3,631 | $2,029 | $1,602 |
| 2023 | $92 | $3,554 | $2,029 | $1,525 |
| 2022 | $98 | $3,554 | $2,029 | $1,525 |
| 2021 | $99 | $3,495 | $1,970 | $1,525 |
| 2020 | $150 | $5,304 | $3,948 | $1,356 |
| 2019 | $151 | $5,304 | $3,948 | $1,356 |
| 2018 | $151 | $5,304 | $3,948 | $1,356 |
| 2017 | $364 | $17,240 | $3,948 | $13,292 |
| 2016 | $364 | $17,240 | $3,948 | $13,292 |
| 2015 | $411 | $20,396 | $7,104 | $13,292 |
| 2014 | $412 | $20,397 | $7,104 | $13,292 |
| 2013 | -- | $20,396 | $7,104 | $13,292 |
Source: Public Records
Map
Nearby Homes
- 5639 Purvis School Rd
- 2111 Fort Creek Rd
- 2135 Fort Creek Rd
- 3368 Sandhill Rd
- 0 Mitchner Rd Unit 548843
- 0 Adams-Reeves Rd Unit 523648
- 4327 Iron Hill Rd
- 2522 Ellington Airline Rd
- 789 George McDuffie Rd
- 2786 Tudor Rd
- 0 Whitaker Rd Unit 540660
- 1543 Wrens Hwy
- 000 Wrens Hwy
- 259 S Main St
- 3171 Old Augusta Rd
- 3191 Old Augusta Rd
- 122 First St
- 1761 Augusta Hwy
- 290 Neals Mill Rd
- 1463 Lokey Dr