NOT LISTED FOR SALE

447 Amston Rd Colchester, CT 06415

Estimated Value: $374,590 - $391,000

3 Beds
2 Baths
1,387 Sq Ft
$276/Sq Ft Est. Value

Last Sold June 29, 2018

Last sale price $216,000 $156 Per Sq Ft

Est. 77% increase in value since last sale

Current estimated payment $2,413/month

About This Home

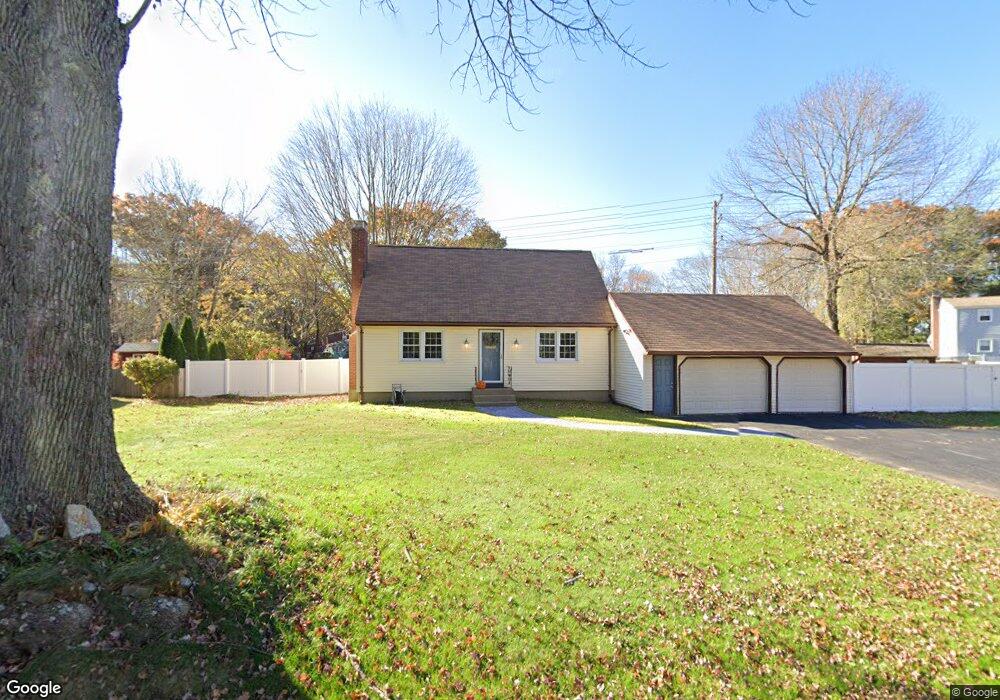
Move right in to immaculate cape style home! Gleaming hardwood floors throughout. The kitchen is open to the formal dining room. Living room with gas fireplace. The first floor bedroom is currently used as a den. The upper level offers 2 large bedrooms, a full bathroom and plenty of storage. The lower level includes a finished room, lots of room for storage, a mechanical room and upgraded windows that slide open. Oversized 2 car garage! Back deck and shed! Generator is hardwired and will convey!

Ownership History

Date Name Owned For Owner Type

Purchase Details

Listed on
Apr 1, 2018
Closed on
Jul 3, 2018
Sold by
Jacqueline D Lower Irt and Lower Thomas C
Bought by
Phaiah Lauren and Phaiah Jarod
Seller's Agent
Sherry Borgeson
Berkshire Hathaway NE Prop.
Buyer's Agent
Jeanne Crum
Home Selling Team
List Price
$219,900
Sold Price
$216,000
Premium/Discount to List
-$3,900
-1.77%
Current Estimated Value
$382,398

Home Financials for this Owner

Home Financials are based on the most recent Mortgage that was taken out on this home.
Estimated Appreciation
$166,398
Avg. Annual Appreciation
7.97%
Original Mortgage
$205,200
Outstanding Balance
$178,230
Interest Rate
4.6%
Mortgage Type
Purchase Money Mortgage
Estimated Equity
$204,168

Purchase Details

Closed on
Feb 17, 1972
Bought by
Lower Charles E and Lower Jacqueline D
Source: Public Records

Range of Values:

--
Value Increase
--
Percent Increase
--
Adjusted for Inflation
Collateral Analytics

Collateral Analytics Collateral Analytics AVMs (Automated Valuation Model) employ a number of statistical approaches combined with neighborhood-specific comparable selection guarantees the most up-to-date and precise valuations.

Not Available

Collateral Analytics does not have data for the current month. Please view the chart for historical values.

ICE

ICE Mortgage Technology ICE Mortgage Technology’s AVM (Automated Valuation Model) is a state-of-the-art online residential property valuation tool that provides a quick and accurate estimate of the value of almost any home in the U.S.

Not Available

ICE Mortgage Technology does not have data for the current month. Please view the chart for historical values.

First American

First American First American Data & Analytics’ next-generation AVM combines unrivaled data assets with a blended ensemble of valuation models to produce highly accurate, reliable valuations you can trust.

Not Available

First American does not have data for the current month. Please view the chart for historical values.

Quantarium

Quantarium Quantarium’s valuation service, repeatedly proven the industry’s most accurate and comprehensive, is supercharged with a self-learning and auto-tuning AI engine that continually becomes smarter and more accurate as it processes daily inputs from the industry’s leading RE data lake.

Not Available

Quantarium does not have data for the current month. Please view the chart for historical values.

Average Value
Not Available
List Price
Sold Price
Create a Home Valuation Report for This Property
The Home Valuation Report is an in-depth analysis detailing your home's value as well as a comparison with similar homes in the area

Home Values in the Area

Source: Public Records

Average Home Value in this Area


Source: Public Records

Purchase History

Date Buyer Sale Price Title Company
Phaiah Lauren $216,000 --
Lower Charles E -- --
Source: Public Records

Mortgage History

Date Status Borrower Loan Amount
Open Phaiah Lauren $205,200
Source: Public Records

Property History

Date Event Price List to Sale Price per Sq Ft Prior Sale
06/29/2018 06/29/18 Sold $216,000 -1.8% $119 / Sq Ft View Prior Sale
04/01/2018 04/01/18 For Sale $219,900 -- $121 / Sq Ft

Tax History Compared to Growth

Source: Public Records

Tax History

Year Tax Paid Tax Assessment Tax Assessment Total Assessment is a certain percentage of the fair market value that is determined by local assessors to be the total taxable value of land and additions on the property. Land Improvement
2025 $4,880 $163,100 $37,100 $126,000
2024 $4,676 $163,100 $37,100 $126,000
2023 $4,440 $163,100 $37,100 $126,000
2022 $4,417 $163,100 $37,100 $126,000
2021 $2,429 $123,200 $34,000 $89,200
2020 $4,046 $123,200 $34,000 $89,200
2019 $4,046 $123,200 $34,000 $89,200
2018 $3,922 $121,500 $34,000 $87,500
2017 $3,933 $121,500 $34,000 $87,500
2016 $3,994 $129,200 $45,100 $84,100
2015 $3,974 $129,200 $45,100 $84,100
2014 $3,950 $129,200 $45,100 $84,100
Source: Public Records

Agents Affiliated with this Home

  • Section Image
  • Section Image
See All Agents

Map