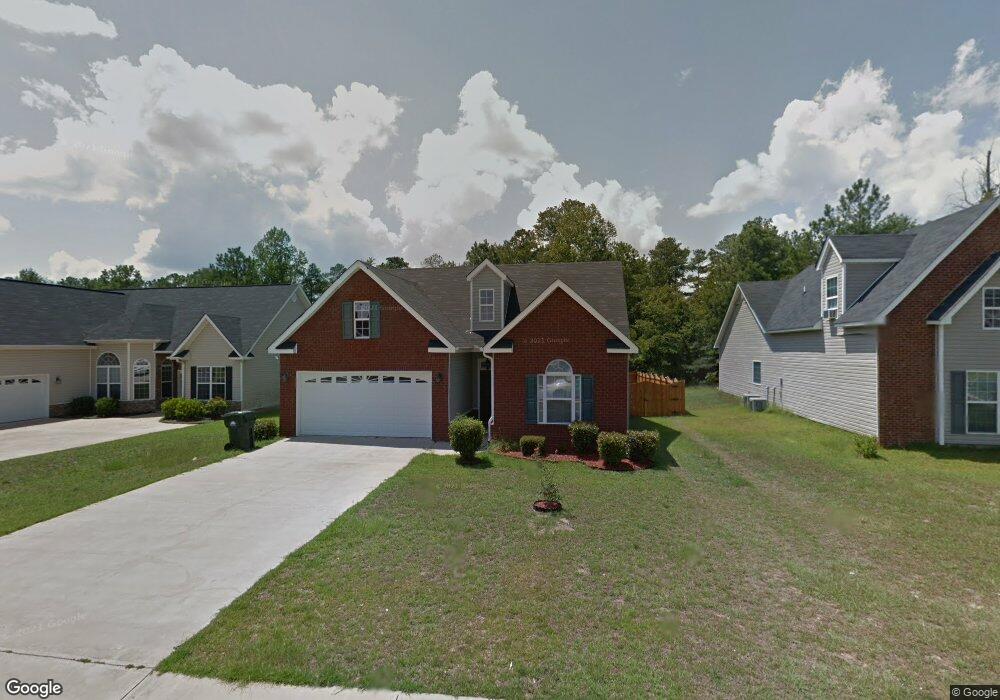
447 Apple Blossom Way Macon, GA 31217
Estimated Value: $154,000 - $202,000
3
Beds
2
Baths
1,686
Sq Ft
$110/Sq Ft
Est. Value
About This Home
This home is located at 447 Apple Blossom Way, Macon, GA 31217 and is currently estimated at $184,954, approximately $109 per square foot. 447 Apple Blossom Way is a home located in Bibb County with nearby schools including Bernd Elementary School, Appling Middle School, and Northeast High School.
Ownership History
Date
Name
Owned For
Owner Type
Purchase Details
Closed on
Mar 17, 2010
Sold by
Fannie Mae
Bought by
Stephens Kaiya
Current Estimated Value
Home Financials for this Owner
Home Financials are based on the most recent Mortgage that was taken out on this home.
Original Mortgage
$7,500
Outstanding Balance
$4,934
Interest Rate
4.91%
Mortgage Type
Stand Alone Second
Estimated Equity
$180,020
Purchase Details
Closed on
Jun 2, 2009
Sold by
Indymac Federal Bank Fsb
Bought by
Fed National Mortg Corp
Purchase Details
Closed on
Jul 26, 2007
Sold by
J D Quality Homes Llc
Bought by
Armstrong Napolian
Home Financials for this Owner
Home Financials are based on the most recent Mortgage that was taken out on this home.
Original Mortgage
$135,400
Interest Rate
6.65%
Mortgage Type
Unknown
Purchase Details
Closed on
Jul 1, 2004
Create a Home Valuation Report for This Property
The Home Valuation Report is an in-depth analysis detailing your home's value as well as a comparison with similar homes in the area
Home Values in the Area
Average Home Value in this Area
Purchase History
| Date | Buyer | Sale Price | Title Company |
|---|---|---|---|
| Stephens Kaiya | $89,000 | None Available | |
| Fed National Mortg Corp | $112,100 | -- | |
| Federal National Mortgage Association | $112,115 | None Available | |
| Indymac Federal Bank Fsb | $112,114 | None Available | |
| Armstrong Napolian | $135,400 | None Available | |
| -- | -- | -- |
Source: Public Records
Mortgage History
| Date | Status | Borrower | Loan Amount |
|---|---|---|---|
| Open | Stephens Kaiya | $7,500 | |
| Open | Stephens Kaiya | $82,926 | |
| Previous Owner | Armstrong Napolian | $135,400 |
Source: Public Records
Tax History Compared to Growth
Tax History
| Year | Tax Paid | Tax Assessment Tax Assessment Total Assessment is a certain percentage of the fair market value that is determined by local assessors to be the total taxable value of land and additions on the property. | Land | Improvement |
|---|---|---|---|---|
| 2025 | $1,513 | $68,588 | $6,000 | $62,588 |
| 2024 | $1,326 | $59,200 | $6,000 | $53,200 |
| 2023 | $869 | $59,200 | $6,000 | $53,200 |
| 2022 | $1,821 | $59,602 | $7,820 | $51,782 |
| 2021 | $1,587 | $48,761 | $5,984 | $42,777 |
| 2020 | $1,730 | $51,565 | $5,440 | $46,125 |
| 2019 | $1,519 | $45,798 | $5,100 | $40,698 |
| 2018 | $2,018 | $37,659 | $5,100 | $32,559 |
| 2017 | $1,081 | $35,846 | $6,000 | $29,846 |
| 2016 | $998 | $35,846 | $6,000 | $29,846 |
| 2015 | $1,413 | $35,846 | $6,000 | $29,846 |
| 2014 | $1,416 | $35,846 | $6,000 | $29,846 |
Source: Public Records
Map
Nearby Homes
- 631 Crabapple Place
- 253 Apple Valley Rd
- 5151 Riggins Mill Rd
- 2766 Stanley Dr
- 2776 Stanley Dr
- 2975 Frederick Dr
- 3741 Franklinton Rd
- 4462 Riggins Mill Rd
- 3917 Jeffersonville Rd
- 5055 Riggins Mill Rd
- 4255 Training School Rd
- 4240 Training School Rd
- 3909 Jeffersonville Rd
- 3335 Esther Dr
- 3320 Jones Dr
- 4231 Donnan Rd
- 5503 Jeffersonville Rd
- 3954 Ocmulgee Blvd E
- 445 Apple Blossom Way
- 451 Apple Blossom Way
- 453 Apple Blossom Way
- 443 Apple Blossom Way
- 455 Apple Blossom Way
- 441 Apple Blossom Way
- 448 Apple Blossom Way
- 446 Apple Blossom Way
- 444 Apple Blossom Way
- 439 Apple Blossom Way
- 454 Apple Blossom Way
- 457 Apple Blossom Way
- 442 Apple Blossom Way
- 456 Apple Blossom Way
- 437 Apple Blossom Way
- 459 Apple Blossom Way
- 440 Apple Blossom Way
- 458 Apple Blossom Way
- 617 Crabapple Place
- 615 Crabapple Place