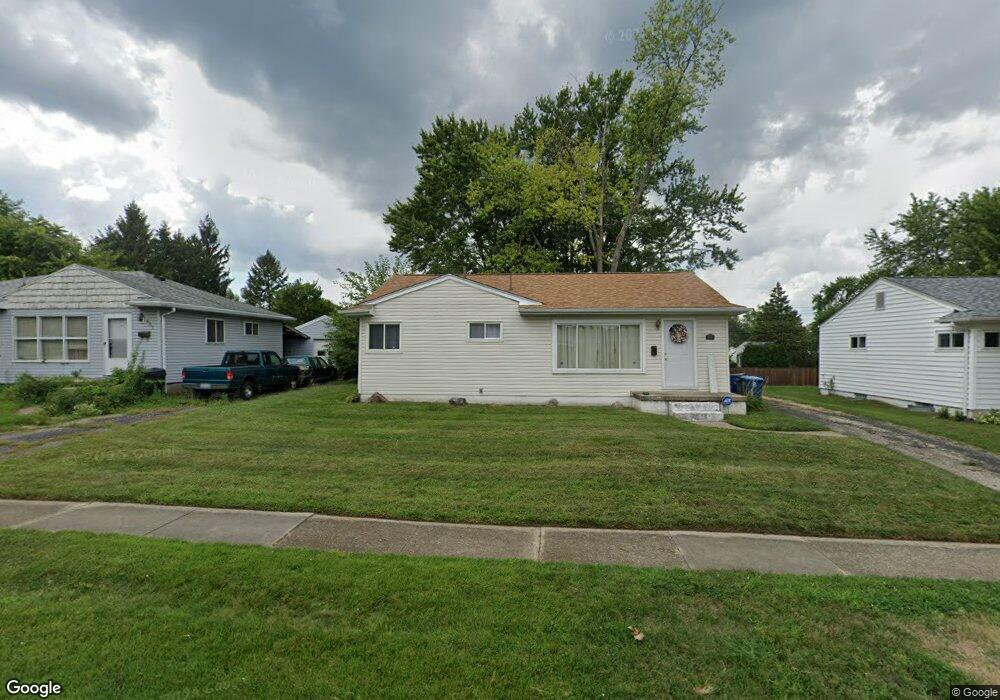
447 Danforth Place Dayton, OH 45431
Estimated Value: $139,757 - $174,000
2
Beds
1
Bath
988
Sq Ft
$164/Sq Ft
Est. Value
About This Home
This home is located at 447 Danforth Place, Dayton, OH 45431 and is currently estimated at $161,689, approximately $163 per square foot. 447 Danforth Place is a home located in Montgomery County with nearby schools including Stebbins High School, St. Helen Elementary School, and East Dayton Christian School.
Ownership History
Date
Name
Owned For
Owner Type
Purchase Details
Closed on
Nov 29, 2009
Sold by
Dice William D
Bought by
Dice Alison L and Dittner Alison L
Current Estimated Value
Purchase Details
Closed on
Mar 28, 2001
Sold by
Dittner Alison L
Bought by
Dittner Alison L and Dice William D
Home Financials for this Owner
Home Financials are based on the most recent Mortgage that was taken out on this home.
Original Mortgage
$67,656
Outstanding Balance
$23,709
Interest Rate
7.02%
Mortgage Type
FHA
Estimated Equity
$137,980
Purchase Details
Closed on
Mar 22, 2001
Sold by
Beaman Raymond A and Beaman Genevieve H
Bought by
Dittner Alison L
Home Financials for this Owner
Home Financials are based on the most recent Mortgage that was taken out on this home.
Original Mortgage
$67,656
Outstanding Balance
$23,709
Interest Rate
7.02%
Mortgage Type
FHA
Estimated Equity
$137,980
Create a Home Valuation Report for This Property
The Home Valuation Report is an in-depth analysis detailing your home's value as well as a comparison with similar homes in the area
Home Values in the Area
Average Home Value in this Area
Purchase History
| Date | Buyer | Sale Price | Title Company |
|---|---|---|---|
| Dice Alison L | -- | Attorney | |
| Dittner Alison L | -- | -- | |
| Dittner Alison L | $68,500 | -- |
Source: Public Records
Mortgage History
| Date | Status | Borrower | Loan Amount |
|---|---|---|---|
| Open | Dittner Alison L | $67,656 |
Source: Public Records
Tax History
| Year | Tax Paid | Tax Assessment Tax Assessment Total Assessment is a certain percentage of the fair market value that is determined by local assessors to be the total taxable value of land and additions on the property. | Land | Improvement |
|---|---|---|---|---|
| 2025 | $1,824 | $36,930 | $7,930 | $29,000 |
| 2024 | $1,791 | $36,930 | $7,930 | $29,000 |
| 2023 | $1,791 | $36,930 | $7,930 | $29,000 |
| 2022 | $1,661 | $25,550 | $5,250 | $20,300 |
| 2021 | $1,692 | $25,550 | $5,250 | $20,300 |
| 2020 | $1,692 | $25,550 | $5,250 | $20,300 |
| 2019 | $1,706 | $23,010 | $5,250 | $17,760 |
| 2018 | $1,710 | $23,010 | $5,250 | $17,760 |
| 2017 | $1,706 | $23,010 | $5,250 | $17,760 |
| 2016 | $1,742 | $22,830 | $5,250 | $17,580 |
| 2015 | $1,871 | $22,830 | $5,250 | $17,580 |
| 2014 | $1,871 | $22,830 | $5,250 | $17,580 |
| 2012 | -- | $24,660 | $7,700 | $16,960 |
Source: Public Records
Map
Nearby Homes
- 379 Lawver Ln
- 551 Ketcham St
- 441 Townsend Place
- 801 Crestmont Dr
- 239 Travis Dr
- 5187 Bayside Dr
- 5303 Underwood Rd
- 464 Darnell Dr
- 5311 Eastman Ave
- 4328 Richland Ave
- 4301 Richland Ave
- 5713 Mayville Dr
- 2230 Hazelton Ave
- 5664 Mayville Dr
- 2400 Longview Ave
- 1301 Ames Ave
- 1176 Irmal Dr
- 715 Kirk Lynne St
- 4137 Lavina Ct
- 719 Cosler Dr
- 457 Danforth Place
- 439 Danforth Place
- 463 Danforth Place
- 446 Twinning Dr
- 5640 Bayside Dr
- 456 Twinning Dr
- 438 Twinning Dr
- 5628 Bayside Dr
- 464 Twinning Dr
- 446 Danforth Place
- 473 Danforth Place
- 432 Danforth Place
- 456 Danforth Place
- 430 Twinning Dr
- 474 Twinning Dr
- 464 Danforth Place
- 5614 Bayside Dr
- 483 Danforth Place
- 5676 Bayside Dr
- 474 Danforth Place
Your Personal Tour Guide
Ask me questions while you tour the home.