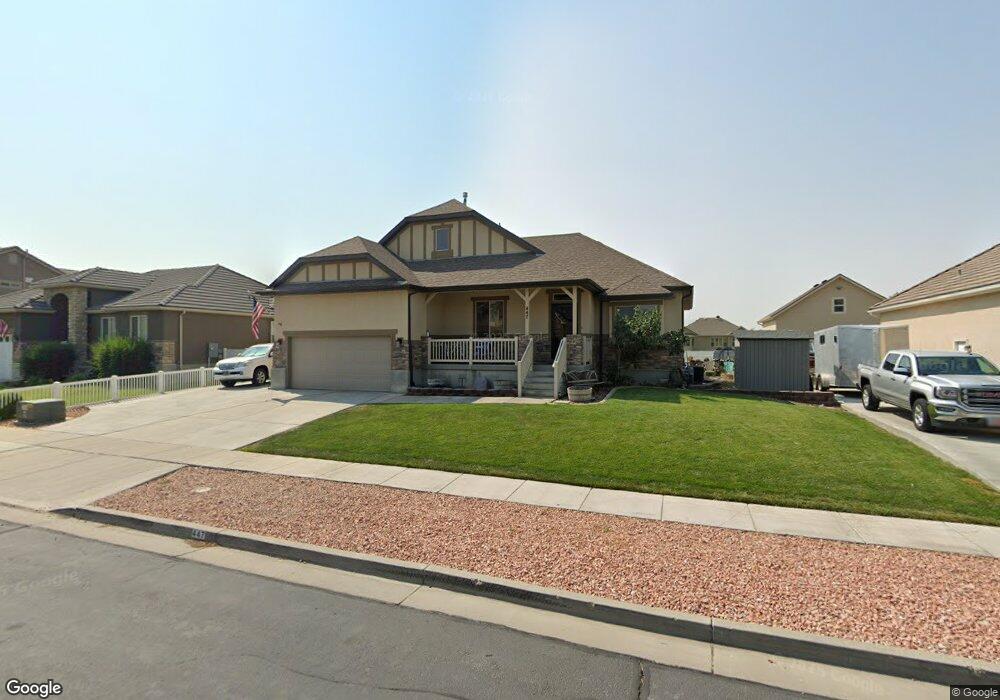
447 Delancey St Tooele, UT 84074
Estimated Value: $500,000 - $584,000
3
Beds
2
Baths
3,126
Sq Ft
$171/Sq Ft
Est. Value
About This Home
This home is located at 447 Delancey St, Tooele, UT 84074 and is currently estimated at $534,965, approximately $171 per square foot. 447 Delancey St is a home located in Tooele County with nearby schools including Stansbury Park Elementary School, Clarke N. Johnsen Junior High School, and Stansbury High School.
Ownership History
Date
Name
Owned For
Owner Type
Purchase Details
Closed on
Dec 12, 2016
Sold by
Sweat Joseph M
Bought by
Weisner Andrew John and Weisner Rachel L
Current Estimated Value
Home Financials for this Owner
Home Financials are based on the most recent Mortgage that was taken out on this home.
Original Mortgage
$265,109
Outstanding Balance
$215,577
Interest Rate
3.75%
Mortgage Type
FHA
Estimated Equity
$319,388
Purchase Details
Closed on
Aug 20, 2013
Sold by
Johnson Mathew and Johnson Angela
Bought by
Sweat Joseph M and Sweat Melven J
Purchase Details
Closed on
Feb 16, 2010
Sold by
Johnson Mathew
Bought by
Johnson Matthew and Johnson Angela
Home Financials for this Owner
Home Financials are based on the most recent Mortgage that was taken out on this home.
Original Mortgage
$228,666
Interest Rate
5.25%
Mortgage Type
FHA
Purchase Details
Closed on
Jan 25, 2007
Sold by
Boyer Plumb Stansbury Llc
Bought by
Richmond American Homes Of Utah Inc
Create a Home Valuation Report for This Property
The Home Valuation Report is an in-depth analysis detailing your home's value as well as a comparison with similar homes in the area
Home Values in the Area
Average Home Value in this Area
Purchase History
| Date | Buyer | Sale Price | Title Company |
|---|---|---|---|
| Weisner Andrew John | -- | Equity Title Union Heights | |
| Sweat Joseph M | -- | Inwest Title Tooele Office | |
| Johnson Matthew | -- | First American Title Ins | |
| Richmond American Homes Of Utah Inc | -- | Landmark Title Co |
Source: Public Records
Mortgage History
| Date | Status | Borrower | Loan Amount |
|---|---|---|---|
| Open | Weisner Andrew John | $265,109 | |
| Previous Owner | Johnson Matthew | $228,666 |
Source: Public Records
Tax History Compared to Growth
Tax History
| Year | Tax Paid | Tax Assessment Tax Assessment Total Assessment is a certain percentage of the fair market value that is determined by local assessors to be the total taxable value of land and additions on the property. | Land | Improvement |
|---|---|---|---|---|
| 2025 | $3,351 | $423,493 | $116,800 | $306,693 |
| 2024 | $3,834 | $246,313 | $64,240 | $182,073 |
| 2023 | $3,834 | $246,165 | $81,400 | $164,765 |
| 2022 | $3,244 | $260,293 | $59,664 | $200,629 |
| 2021 | $2,714 | $179,902 | $47,014 | $132,888 |
| 2020 | $2,659 | $308,238 | $66,400 | $241,838 |
| 2019 | $2,569 | $292,837 | $66,400 | $226,437 |
| 2018 | $2,325 | $253,937 | $50,000 | $203,937 |
| 2017 | $2,114 | $244,226 | $50,000 | $194,226 |
| 2016 | $1,835 | $120,391 | $27,500 | $92,891 |
| 2015 | $1,835 | $115,133 | $0 | $0 |
| 2014 | -- | $115,133 | $0 | $0 |
Source: Public Records
Map
Nearby Homes
- 485 Delancey St
- 395 W Broome St
- 5784 Manhattan Dr
- 5668 Ibis Rd
- 5668 N Ibis Rd
- 590 W Junegrass Ln
- 5644 Ibis Rd
- 5644 N Ibis Rd
- 598 W Junegrass Ln
- 595 W Junegrass Ln
- 622 W Junegrass Ln
- Parleys Plan at Sagewood Village - Gardens
- 1350 Garden Plan at Sagewood Village - Gardens
- 633 W Junegrass Ln
- 642 W Mulberry St
- 647 W Mulberry St
- 5943 N Bleeker St
- 138 W Morning Glory Cir
- 692 W Junegrass Ln
- 5675 Lanyard Ln
- 435 Delancey St
- 459 Delancey St
- 423 Delancey St
- 452 Delancey St
- 440 Delancey St
- 473 Delancey St
- 428 Delancey St
- 411 Delancey St
- 485 Delancey St Unit LT 102
- 474 Delancey St
- 416 Delancey St
- 452 W Morning View Way Unit 118
- 452 W Morning View Way
- 436 W Morning View Way Unit 117
- 436 W Morning View Way
- 452 Morning View Way
- 451 Broom St
- 441 Broom St
- 468 W Morning View Way
- 429 Broom St