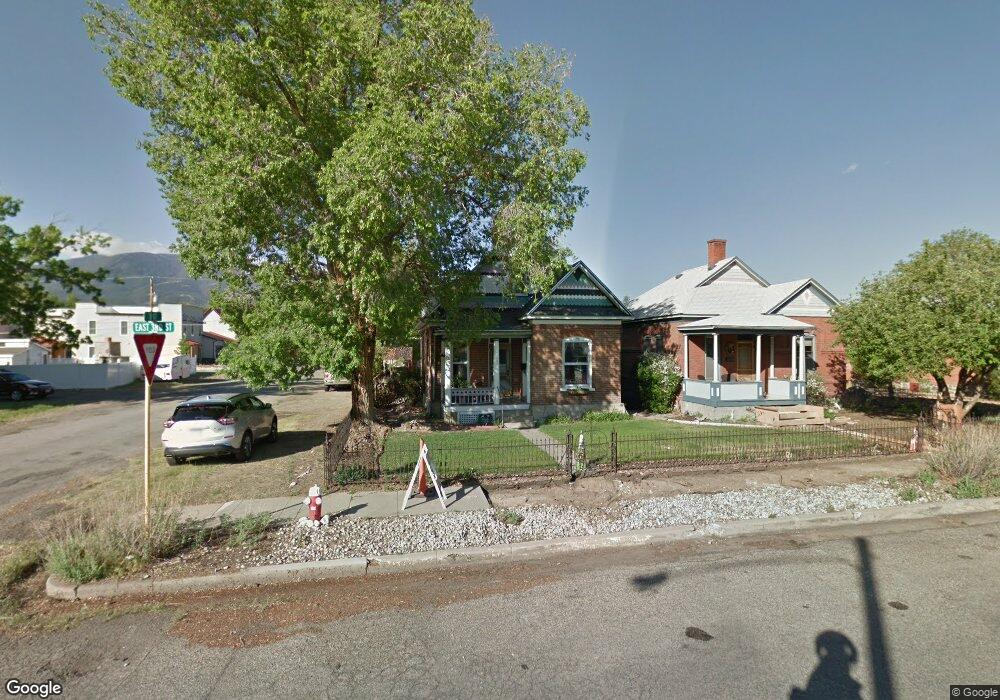
447 E 3rd St Salida, CO 81201
Estimated Value: $602,261 - $703,000
3
Beds
2
Baths
1,300
Sq Ft
$515/Sq Ft
Est. Value
About This Home
This home is located at 447 E 3rd St, Salida, CO 81201 and is currently estimated at $670,065, approximately $515 per square foot. 447 E 3rd St is a home located in Chaffee County with nearby schools including Longfellow Elementary School, Salida Middle School, and Horizons Exploratory Academy.
Ownership History
Date
Name
Owned For
Owner Type
Purchase Details
Closed on
Dec 23, 2011
Sold by
Thompson Teresa L
Bought by
Naylor Jennifer
Current Estimated Value
Home Financials for this Owner
Home Financials are based on the most recent Mortgage that was taken out on this home.
Original Mortgage
$141,000
Outstanding Balance
$11,268
Interest Rate
4.03%
Mortgage Type
New Conventional
Estimated Equity
$658,797
Purchase Details
Closed on
Nov 8, 2011
Sold by
Thompson Teresa and Thompson George Michael
Bought by
Thompson Teresa L
Home Financials for this Owner
Home Financials are based on the most recent Mortgage that was taken out on this home.
Original Mortgage
$141,000
Outstanding Balance
$11,268
Interest Rate
4.03%
Mortgage Type
New Conventional
Estimated Equity
$658,797
Purchase Details
Closed on
Feb 4, 2011
Sold by
Thompson George Michael and Thompson Teresa L
Bought by
Thompson Teresa L
Create a Home Valuation Report for This Property
The Home Valuation Report is an in-depth analysis detailing your home's value as well as a comparison with similar homes in the area
Home Values in the Area
Average Home Value in this Area
Purchase History
| Date | Buyer | Sale Price | Title Company |
|---|---|---|---|
| Naylor Jennifer | $240,000 | None Avalible | |
| Thompson Teresa L | -- | None Avalible | |
| Thompson Teresa L | -- | -- |
Source: Public Records
Mortgage History
| Date | Status | Borrower | Loan Amount |
|---|---|---|---|
| Open | Naylor Jennifer | $141,000 |
Source: Public Records
Tax History
| Year | Tax Paid | Tax Assessment Tax Assessment Total Assessment is a certain percentage of the fair market value that is determined by local assessors to be the total taxable value of land and additions on the property. | Land | Improvement |
|---|---|---|---|---|
| 2025 | $1,910 | $38,150 | $12,870 | $25,280 |
| 2024 | $1,910 | $42,400 | $13,800 | $28,600 |
| 2023 | $1,848 | $42,400 | $13,800 | $28,600 |
| 2022 | $1,336 | $28,020 | $11,290 | $16,730 |
| 2021 | $1,340 | $28,820 | $11,610 | $17,210 |
| 2020 | $1,248 | $25,490 | $5,680 | $19,810 |
| 2019 | $1,250 | $25,490 | $5,680 | $19,810 |
| 2018 | $1,038 | $21,470 | $5,880 | $15,590 |
| 2017 | $1,012 | $21,470 | $5,880 | $15,590 |
| 2016 | $954 | $19,830 | $5,630 | $14,200 |
| 2015 | $904 | $19,830 | $5,630 | $14,200 |
| 2014 | $904 | $17,890 | $5,740 | $12,150 |
Source: Public Records
Map
Nearby Homes
Your Personal Tour Guide
Ask me questions while you tour the home.