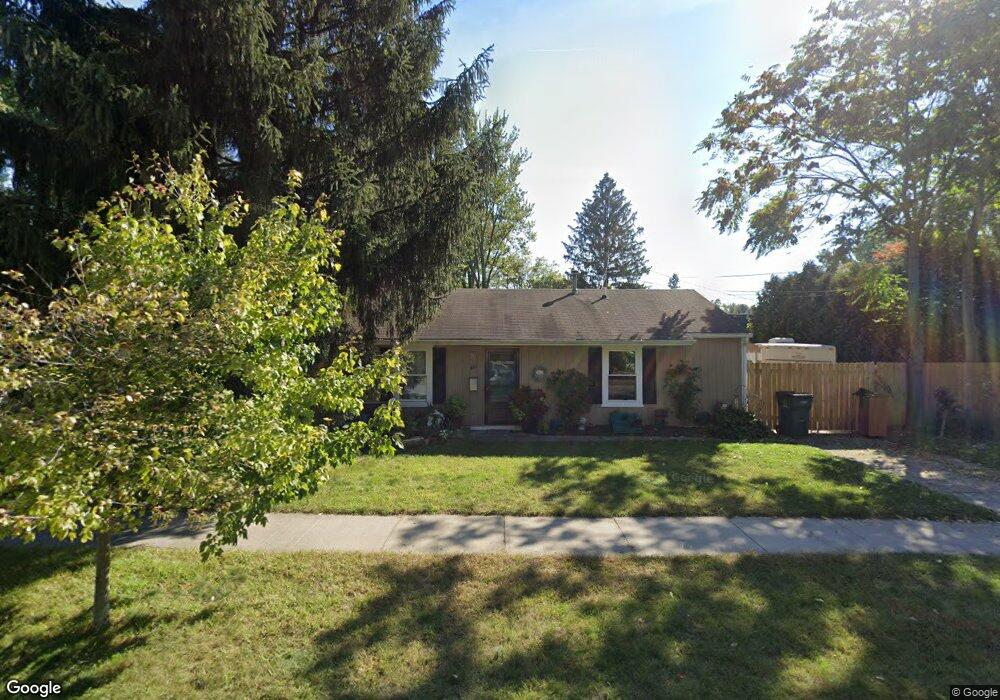
447 Fielding St Unit Bldg-Unit Ferndale, MI 48220
Estimated Value: $220,000 - $258,000
3
Beds
1
Bath
900
Sq Ft
$264/Sq Ft
Est. Value
About This Home
This home is located at 447 Fielding St Unit Bldg-Unit, Ferndale, MI 48220 and is currently estimated at $237,872, approximately $264 per square foot. 447 Fielding St Unit Bldg-Unit is a home located in Oakland County with nearby schools including Ferndale Lower Elementary Campus, Ferndale Upper Elementary Campus, and Ferndale Middle School.
Ownership History
Date
Name
Owned For
Owner Type
Purchase Details
Closed on
Aug 28, 2018
Sold by
Baron Bruce M
Bought by
Dubicki Sherri K
Current Estimated Value
Home Financials for this Owner
Home Financials are based on the most recent Mortgage that was taken out on this home.
Original Mortgage
$112,000
Outstanding Balance
$97,469
Interest Rate
4.5%
Mortgage Type
Adjustable Rate Mortgage/ARM
Estimated Equity
$140,403
Purchase Details
Closed on
Jun 29, 2005
Sold by
Brorby Sara J
Bought by
Baron Bruce M
Purchase Details
Closed on
Apr 7, 2000
Sold by
Macdonald Robert E
Bought by
Brorby Sara J
Home Financials for this Owner
Home Financials are based on the most recent Mortgage that was taken out on this home.
Original Mortgage
$84,305
Interest Rate
8.21%
Purchase Details
Closed on
Feb 7, 1996
Sold by
Arnett Mary P
Bought by
Macdonald Robert E
Create a Home Valuation Report for This Property
The Home Valuation Report is an in-depth analysis detailing your home's value as well as a comparison with similar homes in the area
Home Values in the Area
Average Home Value in this Area
Purchase History
| Date | Buyer | Sale Price | Title Company |
|---|---|---|---|
| Dubicki Sherri K | $140,000 | None Available | |
| Baron Bruce M | $127,500 | Title One Inc | |
| Brorby Sara J | $85,000 | -- | |
| Macdonald Robert E | $56,500 | -- |
Source: Public Records
Mortgage History
| Date | Status | Borrower | Loan Amount |
|---|---|---|---|
| Open | Dubicki Sherri K | $112,000 | |
| Previous Owner | Brorby Sara J | $84,305 |
Source: Public Records
Tax History Compared to Growth
Tax History
| Year | Tax Paid | Tax Assessment Tax Assessment Total Assessment is a certain percentage of the fair market value that is determined by local assessors to be the total taxable value of land and additions on the property. | Land | Improvement |
|---|---|---|---|---|
| 2024 | $4,175 | $112,740 | $0 | $0 |
| 2023 | $4,059 | $103,830 | $0 | $0 |
| 2022 | $4,082 | $94,030 | $0 | $0 |
| 2021 | $4,107 | $83,720 | $0 | $0 |
| 2020 | $3,890 | $76,820 | $0 | $0 |
| 2019 | $3,954 | $70,130 | $0 | $0 |
| 2018 | $2,702 | $59,340 | $0 | $0 |
| 2017 | $2,663 | $58,050 | $0 | $0 |
| 2016 | $2,628 | $47,940 | $0 | $0 |
| 2015 | -- | $39,630 | $0 | $0 |
| 2014 | -- | $34,120 | $0 | $0 |
| 2011 | -- | $36,490 | $0 | $0 |
Source: Public Records
Map
Nearby Homes
- 243 Edgewood Place
- 210 Saint Louis St
- 378 Fielding St
- 482 W 8 Mile Rd
- 457 W Bennett
- 295 W Webster St
- 415 Laprairie St
- 243 W Webster St
- 260 Fielding St
- 2836 Woodstock Dr
- 395 Glendale Ln
- 591 Parkside Way Unit 16
- 168 W Bennett
- 2545 Woodstock Dr
- 2444 Woodstock Dr
- 918 Saint Louis St
- 559 Gardendale St
- 211 Silman St
- 221 Silman St
- 230 E Webster St
- 447 Fielding St
- 430 Saint Louis St
- 427 Fielding St
- 498 Saint Louis St
- 420 Saint Louis St
- 504 Saint Louis St
- 446 Fielding St
- 441 Edgewood Place
- 408 Saint Louis St
- 514 Saint Louis St
- 436 Fielding St
- 425 Edgewood Place
- 419 Edgewood Place
- 479 Saint Louis St Unit LOUIS
- 479 Saint Louis St
- 356 Saint Louis St
- 520 Saint Louis St
- 507 Edgewood Place Unit Bldg-Unit
- 507 Edgewood Place
- 0 Edgewood Place Unit 217108406