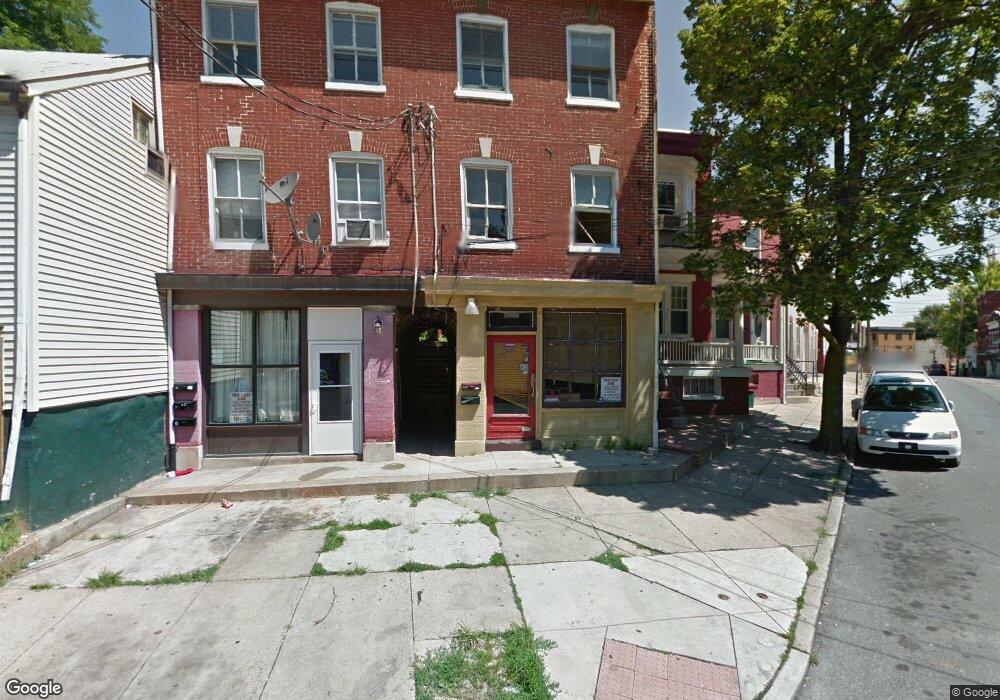
447 Manor St Lancaster, PA 17603
Cabbage Hill NeighborhoodEstimated Value: $339,000 - $414,000
Studio
--
Bath
1,760
Sq Ft
$214/Sq Ft
Est. Value
About This Home
This home is located at 447 Manor St, Lancaster, PA 17603 and is currently estimated at $376,500, approximately $213 per square foot. 447 Manor St is a home located in Lancaster County with nearby schools including Fulton El School, Reynolds Middle School, and McCaskey High School.
Ownership History
Date
Name
Owned For
Owner Type
Purchase Details
Closed on
Jan 5, 2005
Sold by
Redevelopment Authority City Lancaster
Bought by
Joseph Lisa R
Current Estimated Value
Purchase Details
Closed on
Apr 16, 2001
Sold by
Ressler John A
Bought by
Perez Juan
Home Financials for this Owner
Home Financials are based on the most recent Mortgage that was taken out on this home.
Original Mortgage
$80,295
Interest Rate
6.9%
Mortgage Type
Commercial
Purchase Details
Closed on
Feb 14, 2001
Sold by
Ressler John A
Bought by
Ressler John A
Create a Home Valuation Report for This Property
The Home Valuation Report is an in-depth analysis detailing your home's value as well as a comparison with similar homes in the area
Home Values in the Area
Average Home Value in this Area
Purchase History
| Date | Buyer | Sale Price | Title Company |
|---|---|---|---|
| Joseph Lisa R | $15,000 | -- | |
| Perez Juan | $37,500 | -- | |
| Ressler John A | -- | -- |
Source: Public Records
Mortgage History
| Date | Status | Borrower | Loan Amount |
|---|---|---|---|
| Previous Owner | Perez Juan | $80,295 |
Source: Public Records
Tax History
| Year | Tax Paid | Tax Assessment Tax Assessment Total Assessment is a certain percentage of the fair market value that is determined by local assessors to be the total taxable value of land and additions on the property. | Land | Improvement |
|---|---|---|---|---|
| 2025 | $4,883 | $123,400 | $35,600 | $87,800 |
| 2024 | $4,883 | $123,400 | $35,600 | $87,800 |
| 2023 | $4,801 | $123,400 | $35,600 | $87,800 |
| 2022 | $4,601 | $123,400 | $35,600 | $87,800 |
| 2021 | $4,502 | $123,400 | $35,600 | $87,800 |
| 2020 | $4,502 | $123,400 | $35,600 | $87,800 |
| 2019 | $4,435 | $123,400 | $35,600 | $87,800 |
| 2018 | $1,182 | $123,400 | $35,600 | $87,800 |
| 2017 | $1,957 | $42,600 | $20,800 | $21,800 |
| 2016 | $1,939 | $42,600 | $20,800 | $21,800 |
| 2015 | $756 | $42,600 | $20,800 | $21,800 |
| 2014 | $1,692 | $42,600 | $20,800 | $21,800 |
Source: Public Records
Map
Nearby Homes
Your Personal Tour Guide
Ask me questions while you tour the home.