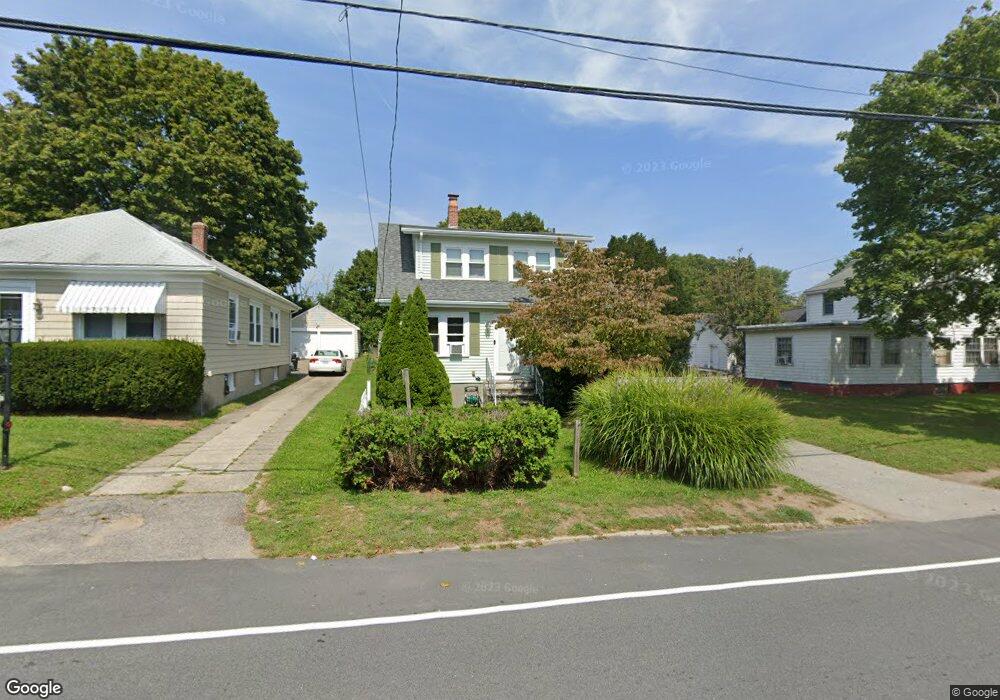
447 Maple Ave Barrington, RI 02806
North Barrington NeighborhoodEstimated Value: $507,897 - $682,000
3
Beds
1
Bath
1,638
Sq Ft
$348/Sq Ft
Est. Value
About This Home
This home is located at 447 Maple Ave, Barrington, RI 02806 and is currently estimated at $569,724, approximately $347 per square foot. 447 Maple Ave is a home located in Bristol County with nearby schools including Barrington High School, St Luke Elementary School, and Barrington Christian Academy.
Ownership History
Date
Name
Owned For
Owner Type
Purchase Details
Closed on
Dec 28, 2007
Sold by
Kenyon Richard Westcot and Young Jessica Millar
Bought by
Lombardo Justin and Lombardo Angela
Current Estimated Value
Home Financials for this Owner
Home Financials are based on the most recent Mortgage that was taken out on this home.
Original Mortgage
$215,460
Interest Rate
6.27%
Mortgage Type
Purchase Money Mortgage
Purchase Details
Closed on
Apr 27, 2005
Sold by
Martone Michael and Martone Lynda Lee
Bought by
Kenyon Richard Westcot and Young Jessica Millar
Home Financials for this Owner
Home Financials are based on the most recent Mortgage that was taken out on this home.
Original Mortgage
$184,000
Interest Rate
5.95%
Mortgage Type
Purchase Money Mortgage
Create a Home Valuation Report for This Property
The Home Valuation Report is an in-depth analysis detailing your home's value as well as a comparison with similar homes in the area
Home Values in the Area
Average Home Value in this Area
Purchase History
| Date | Buyer | Sale Price | Title Company |
|---|---|---|---|
| Lombardo Justin | $227,000 | -- | |
| Kenyon Richard Westcot | $230,000 | -- |
Source: Public Records
Mortgage History
| Date | Status | Borrower | Loan Amount |
|---|---|---|---|
| Open | Kenyon Richard Westcot | $205,950 | |
| Closed | Kenyon Richard Westcot | $215,460 | |
| Previous Owner | Kenyon Richard Westcot | $184,000 |
Source: Public Records
Tax History Compared to Growth
Tax History
| Year | Tax Paid | Tax Assessment Tax Assessment Total Assessment is a certain percentage of the fair market value that is determined by local assessors to be the total taxable value of land and additions on the property. | Land | Improvement |
|---|---|---|---|---|
| 2025 | $6,090 | $397,000 | $173,000 | $224,000 |
| 2024 | $5,856 | $397,000 | $173,000 | $224,000 |
| 2023 | $5,643 | $278,000 | $99,000 | $179,000 |
| 2022 | $5,463 | $278,000 | $99,000 | $179,000 |
| 2021 | $5,324 | $278,000 | $99,000 | $179,000 |
| 2020 | $5,141 | $246,000 | $82,000 | $164,000 |
| 2019 | $4,945 | $246,000 | $82,000 | $164,000 |
| 2018 | $4,797 | $246,000 | $82,000 | $164,000 |
| 2017 | $4,182 | $209,100 | $77,200 | $131,900 |
| 2016 | $3,858 | $209,100 | $77,200 | $131,900 |
| 2015 | $3,816 | $209,100 | $77,200 | $131,900 |
| 2014 | $3,850 | $210,400 | $77,200 | $133,200 |
Source: Public Records
Map
Nearby Homes