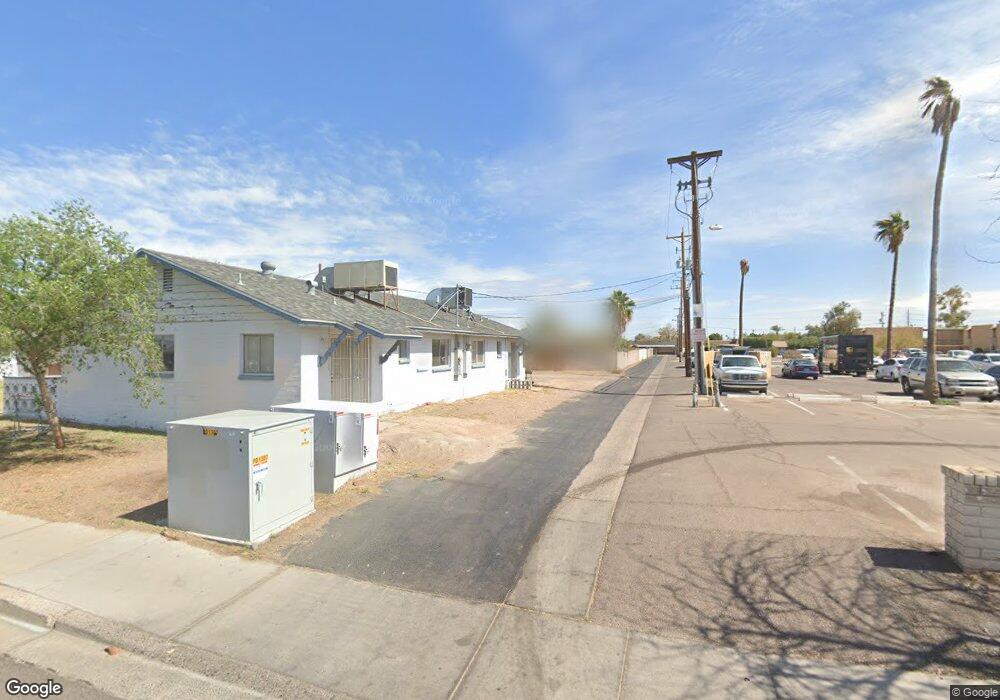
447 N Dobson Rd Mesa, AZ 85201
Riverview NeighborhoodEstimated Value: $319,735 - $426,000
--
Bed
--
Bath
1,325
Sq Ft
$271/Sq Ft
Est. Value
About This Home
This home is located at 447 N Dobson Rd, Mesa, AZ 85201 and is currently estimated at $358,934, approximately $270 per square foot. 447 N Dobson Rd is a home located in Maricopa County with nearby schools including Whittier Elementary School, Franklin at Brimhall Elementary School, and Franklin West Elementary School.
Ownership History
Date
Name
Owned For
Owner Type
Purchase Details
Closed on
Mar 22, 2002
Sold by
Burk Dennis Ray and Burk Betty L
Bought by
Hillcrest Apartments Llc
Current Estimated Value
Purchase Details
Closed on
Dec 24, 2001
Sold by
Burk Dennis Ray and Burk Betty L
Bought by
Burk Dennis Ray and Burk Betty L
Home Financials for this Owner
Home Financials are based on the most recent Mortgage that was taken out on this home.
Original Mortgage
$71,650
Interest Rate
7.01%
Purchase Details
Closed on
Nov 23, 1999
Sold by
Burk Dennis Ray and Burk Betty L
Bought by
Burk Dennis Ray and Burk Betty L
Purchase Details
Closed on
May 15, 1974
Sold by
Munn John H and Munn Theresa M
Bought by
Jacobi F Martin and Jacobi Delores P
Purchase Details
Closed on
Sep 17, 1971
Sold by
East Conrad N and Maybelle East E
Bought by
Munn John H and Munn Theresa M
Create a Home Valuation Report for This Property
The Home Valuation Report is an in-depth analysis detailing your home's value as well as a comparison with similar homes in the area
Home Values in the Area
Average Home Value in this Area
Purchase History
| Date | Buyer | Sale Price | Title Company |
|---|---|---|---|
| Hillcrest Apartments Llc | -- | -- | |
| Burk Dennis Ray | -- | First American Title | |
| Burk Dennis Ray | -- | First American Title | |
| Burk Dennis Ray | -- | -- | |
| Jacobi F Martin | -- | Transamerica Title Ins Co | |
| Munn John H | -- | Transamerica Title Ins Co |
Source: Public Records
Mortgage History
| Date | Status | Borrower | Loan Amount |
|---|---|---|---|
| Previous Owner | Burk Dennis Ray | $71,650 |
Source: Public Records
Tax History Compared to Growth
Tax History
| Year | Tax Paid | Tax Assessment Tax Assessment Total Assessment is a certain percentage of the fair market value that is determined by local assessors to be the total taxable value of land and additions on the property. | Land | Improvement |
|---|---|---|---|---|
| 2025 | $604 | $6,117 | -- | -- |
| 2024 | $605 | $5,826 | -- | -- |
| 2023 | $605 | $20,600 | $5,880 | $14,720 |
| 2022 | $593 | $15,760 | $4,500 | $11,260 |
| 2021 | $600 | $13,130 | $3,750 | $9,380 |
| 2020 | $592 | $11,770 | $3,360 | $8,410 |
| 2019 | $553 | $10,050 | $2,870 | $7,180 |
| 2018 | $531 | $8,240 | $2,350 | $5,890 |
| 2017 | $515 | $7,210 | $2,060 | $5,150 |
| 2016 | $506 | $6,860 | $1,960 | $4,900 |
| 2015 | $475 | $6,100 | $1,740 | $4,360 |
Source: Public Records
Map
Nearby Homes
- 534 N Ironwood
- 451 N San Jose Cir
- 2064 W Camino Cir
- 2130 W Camino St Unit 7
- 301 N Ironwood
- 601 N May Unit 27
- 601 N May Unit 25
- 633 N May Unit 25
- 2064 W 2nd St
- 2727 E University Dr Unit 99
- 2727 E University Dr Unit 134
- 2727 E University Dr Unit 78
- 2727 E University Dr Unit 153
- 2727 E University Dr Unit 62
- 2727 E University Dr Unit 19
- 2727 E University Dr Unit 144
- 2727 E University Dr Unit 55
- 2727 E University Dr Unit 141
- 2727 E University Dr Unit 91
- 1728 W Bentley St
- 447 N Dobson Rd
- 456 N Yucca Cir
- 464 N Yucca Cir
- 445 N Yucca Cir
- 1950 W 6th St
- 450 N Dobson Rd
- 1940 W 6th St
- 1934 W 6th St
- 453 N Yucca Cir
- 461 N Yucca Cir
- 1921 W 6th St
- 1926 W 6th St
- 1920 W 6th St
- 526 N Ironwood
- 520 N Ironwood
- 538 N Ironwood
- 504 N Ironwood
- 438 N Ironwood
- 432 N Ironwood
- 529 N Santa Anna