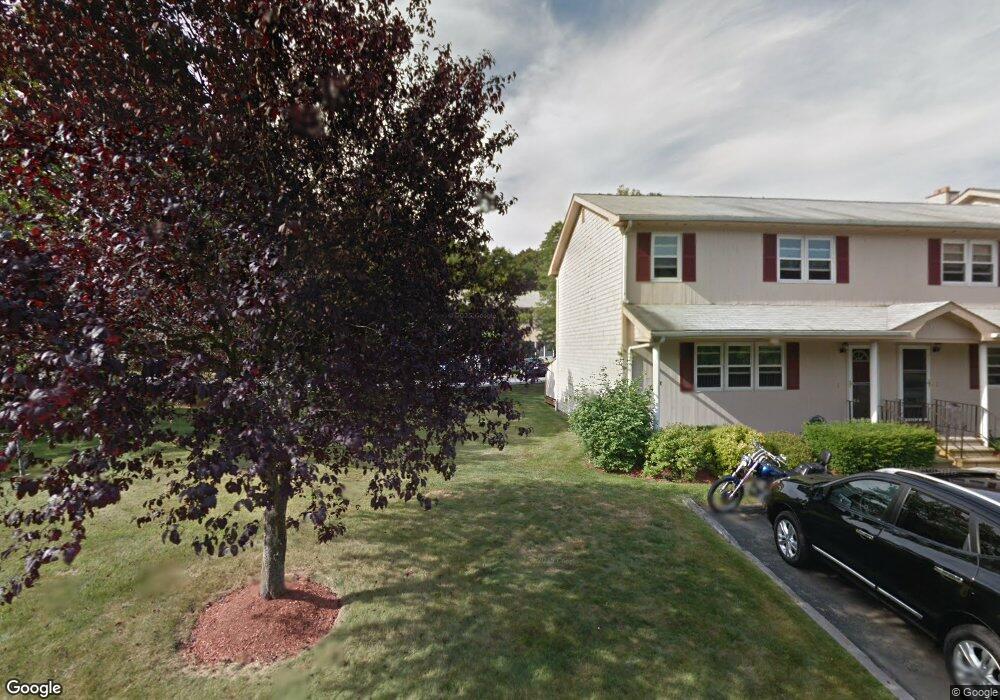
447 Stafford Rd Unit F2 Tiverton, RI 02878
Bliss Corners NeighborhoodEstimated Value: $316,319 - $400,000
2
Beds
2
Baths
1,178
Sq Ft
$291/Sq Ft
Est. Value
About This Home
This home is located at 447 Stafford Rd Unit F2, Tiverton, RI 02878 and is currently estimated at $343,330, approximately $291 per square foot. 447 Stafford Rd Unit F2 is a home located in Newport County with nearby schools including Tiverton High School, Atlantis Charter School, and Holy Trinity School.
Ownership History
Date
Name
Owned For
Owner Type
Purchase Details
Closed on
Nov 26, 1997
Sold by
Souza David A and Souza Linda
Bought by
Grandmaison Kathleen E
Current Estimated Value
Home Financials for this Owner
Home Financials are based on the most recent Mortgage that was taken out on this home.
Original Mortgage
$62,000
Interest Rate
7.26%
Purchase Details
Closed on
Jun 22, 1994
Sold by
Bank Fall River Coop
Bought by
Souza David A and Souza Linda
Home Financials for this Owner
Home Financials are based on the most recent Mortgage that was taken out on this home.
Original Mortgage
$73,350
Interest Rate
8.74%
Purchase Details
Closed on
Oct 13, 1988
Sold by
Har Mel Corp
Bought by
Dimanno John
Home Financials for this Owner
Home Financials are based on the most recent Mortgage that was taken out on this home.
Original Mortgage
$89,900
Interest Rate
10.63%
Create a Home Valuation Report for This Property
The Home Valuation Report is an in-depth analysis detailing your home's value as well as a comparison with similar homes in the area
Home Values in the Area
Average Home Value in this Area
Purchase History
| Date | Buyer | Sale Price | Title Company |
|---|---|---|---|
| Grandmaison Kathleen E | $87,500 | -- | |
| Souza David A | $81,500 | -- | |
| Dimanno John | $104,900 | -- |
Source: Public Records
Mortgage History
| Date | Status | Borrower | Loan Amount |
|---|---|---|---|
| Open | Dimanno John | $50,000 | |
| Closed | Dimanno John | $62,000 | |
| Previous Owner | Dimanno John | $73,350 | |
| Previous Owner | Dimanno John | $89,900 |
Source: Public Records
Tax History Compared to Growth
Tax History
| Year | Tax Paid | Tax Assessment Tax Assessment Total Assessment is a certain percentage of the fair market value that is determined by local assessors to be the total taxable value of land and additions on the property. | Land | Improvement |
|---|---|---|---|---|
| 2025 | $3,027 | $273,900 | $0 | $273,900 |
| 2024 | $3,027 | $273,900 | $0 | $273,900 |
| 2023 | $3,084 | $207,000 | $0 | $207,000 |
| 2022 | $3,028 | $207,000 | $0 | $207,000 |
| 2021 | $2,954 | $207,000 | $0 | $207,000 |
| 2020 | $2,327 | $143,700 | $0 | $143,700 |
| 2019 | $2,269 | $143,700 | $0 | $143,700 |
| 2018 | $2,355 | $143,700 | $0 | $143,700 |
| 2017 | $2,667 | $140,000 | $0 | $140,000 |
| 2016 | $2,680 | $140,000 | $0 | $140,000 |
| 2015 | $2,680 | $140,000 | $0 | $140,000 |
| 2014 | $3,213 | $166,500 | $0 | $166,500 |
Source: Public Records
Map
Nearby Homes
- 447 Stafford Rd Unit E7
- 447 Stafford Rd Unit E4
- 447 Stafford Rd Unit C4
- 507R Stafford Rd
- 507 Stafford Rd
- 185 Stafford Rd
- 75 Montgomery St
- 3 Blackbird St
- 9 Blackbird St
- 18 Mockingbird Ln
- 38 Hummingbird Ln
- 70 Robin Dr
- 100 Corys Ln
- 64 Robin Dr Unit 2-84
- 71 Blackbird St
- 84 Lark Ln
- 37 Bluejay St
- 206 Songbird Ln
- 0 Stafford Rd Unit 1393774
- 0 Stafford Rd Unit 73431501
- 447 Stafford Rd Unit C2
- 447 Stafford Rd Unit B2
- 447 Stafford Rd Unit B3
- 447 Stafford Rd Unit F1
- 447 Stafford Rd Unit D8
- 447 Stafford Rd Unit D6
- 447 Stafford Rd Unit E6
- 447 Stafford Rd Unit D3
- 447 Stafford Rd Unit E2
- 447 Stafford Rd Unit D5
- 447 Stafford Rd Unit D4
- 447 Stafford Rd Unit E5
- 447 Stafford Rd Unit F3
- 447 Stafford Rd Unit F4
- 447 Stafford Rd Unit D7
- 447 Stafford Rd Unit E8
- 447 Stafford Rd Unit E3
- 447 Stafford Rd Unit E1
- 447 Stafford Rd Unit D2
- 447 Stafford Rd Unit D1