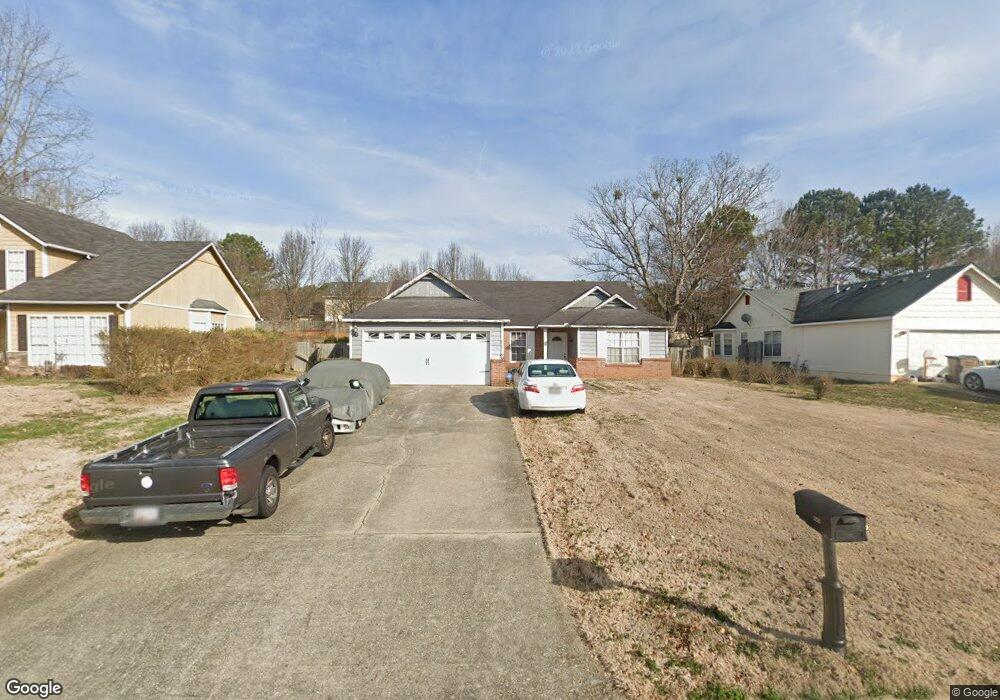
447 Thomas Downs Way Unit II Jonesboro, GA 30238
Estimated Value: $228,000 - $266,000
3
Beds
2
Baths
1,808
Sq Ft
$133/Sq Ft
Est. Value
About This Home
This home is located at 447 Thomas Downs Way Unit II, Jonesboro, GA 30238 and is currently estimated at $240,390, approximately $132 per square foot. 447 Thomas Downs Way Unit II is a home located in Clayton County with nearby schools including Kemp Primary School, Kemp Elementary School, and Mundys Mill Middle School.
Ownership History
Date
Name
Owned For
Owner Type
Purchase Details
Closed on
Feb 19, 1997
Sold by
Sosa Ceres G
Bought by
Howard Lynwood J
Current Estimated Value
Create a Home Valuation Report for This Property
The Home Valuation Report is an in-depth analysis detailing your home's value as well as a comparison with similar homes in the area
Home Values in the Area
Average Home Value in this Area
Purchase History
| Date | Buyer | Sale Price | Title Company |
|---|---|---|---|
| Howard Lynwood J | $84,000 | -- |
Source: Public Records
Mortgage History
| Date | Status | Borrower | Loan Amount |
|---|---|---|---|
| Closed | Howard Lynwood J | $0 |
Source: Public Records
Tax History Compared to Growth
Tax History
| Year | Tax Paid | Tax Assessment Tax Assessment Total Assessment is a certain percentage of the fair market value that is determined by local assessors to be the total taxable value of land and additions on the property. | Land | Improvement |
|---|---|---|---|---|
| 2025 | $1,508 | $88,800 | $6,216 | $82,584 |
| 2024 | $1,565 | $88,800 | $6,216 | $82,584 |
| 2023 | $1,881 | $99,080 | $7,200 | $91,880 |
| 2022 | $2,748 | $79,120 | $7,200 | $71,920 |
| 2021 | $2,027 | $60,440 | $7,200 | $53,240 |
| 2020 | $1,796 | $54,031 | $7,200 | $46,831 |
| 2019 | $917 | $31,715 | $5,600 | $26,115 |
| 2018 | $917 | $31,715 | $5,600 | $26,115 |
| 2017 | $919 | $35,238 | $5,600 | $29,638 |
| 2016 | $1,076 | $35,583 | $5,600 | $29,983 |
| 2015 | $1,073 | $0 | $0 | $0 |
| 2014 | $790 | $28,953 | $5,600 | $23,353 |
Source: Public Records
Map
Nearby Homes
- 9404 Cypress Ln
- 9556 Thomas Downs Ln Unit 1
- 301 Deerfield Dr
- 9404 Bogey Ct
- 9383 Woodknoll Way Unit 4
- 9342 Thomas Rd
- 9409 Forest Knoll Dr
- 281 Willow Springs Dr
- 288 Country Club Dr
- 316 River Chase Dr
- 22 Fairview Dr
- 296 Country Club Dr
- 556 Country Greens Dr
- 299 Country Club Dr
- 237 Country Club Dr
- 254 Country Club Dr
- 226 Woodwind Way
- 725 River Mist Dr
- 251 River Chase Dr
- 273 Martin Dr
- 439 Thomas Downs Way
- 455 Thomas Downs Way
- 431 Thomas Downs Way
- 448 Brookfield Way
- 456 Brookfield Way
- 438 Brookfield Way
- 446 Thomas Downs Way
- 454 Thomas Downs Way
- 423 Thomas Downs Way
- 471 Thomas Downs Way
- 438 Thomas Downs Way
- 430 Brookfield Way
- 462 Thomas Downs Way Unit II
- 430 Thomas Downs Way
- 430 Thomas Downs Way Unit 11
- 470 Brookfield Way
- 470 Thomas Downs Way
- 422 Brookfield Way
- 415 Thomas Downs Way Unit 2
- 479 Thomas Downs Way